Explore 3.17 Radioactivity & the Age of Earth
Learning Objectives
By the time you have completed the 3.17. Introduction & Exploration Activities, you should be able to:
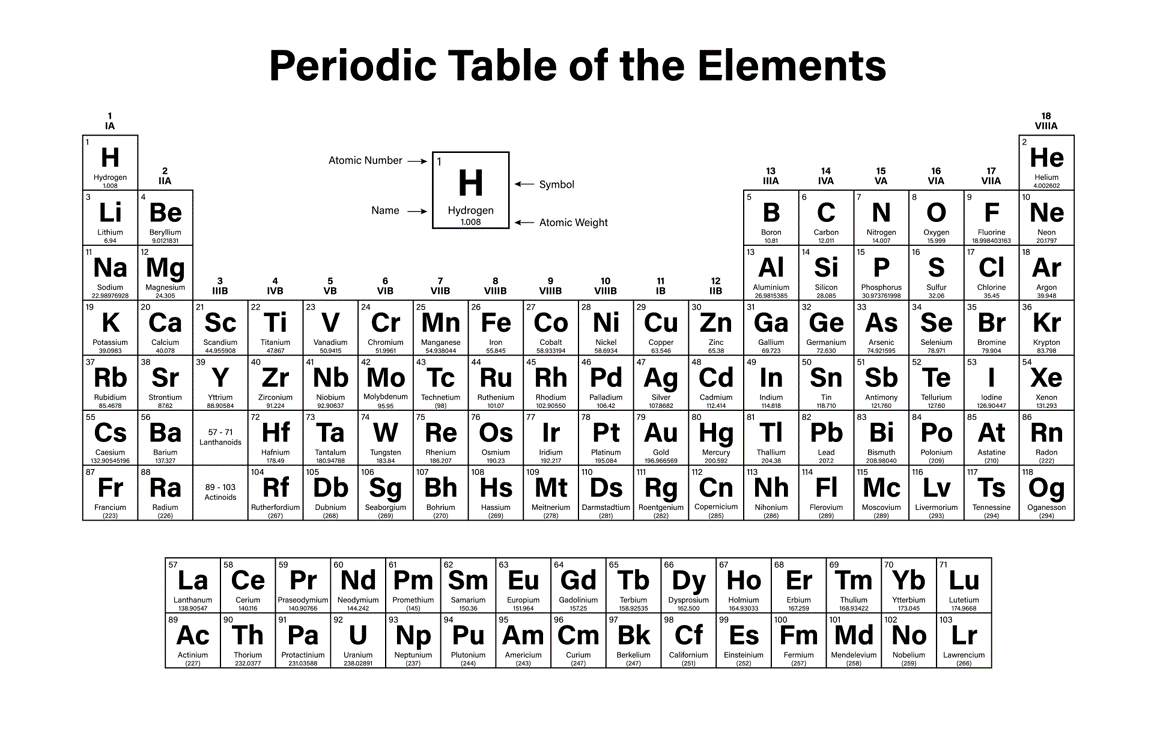
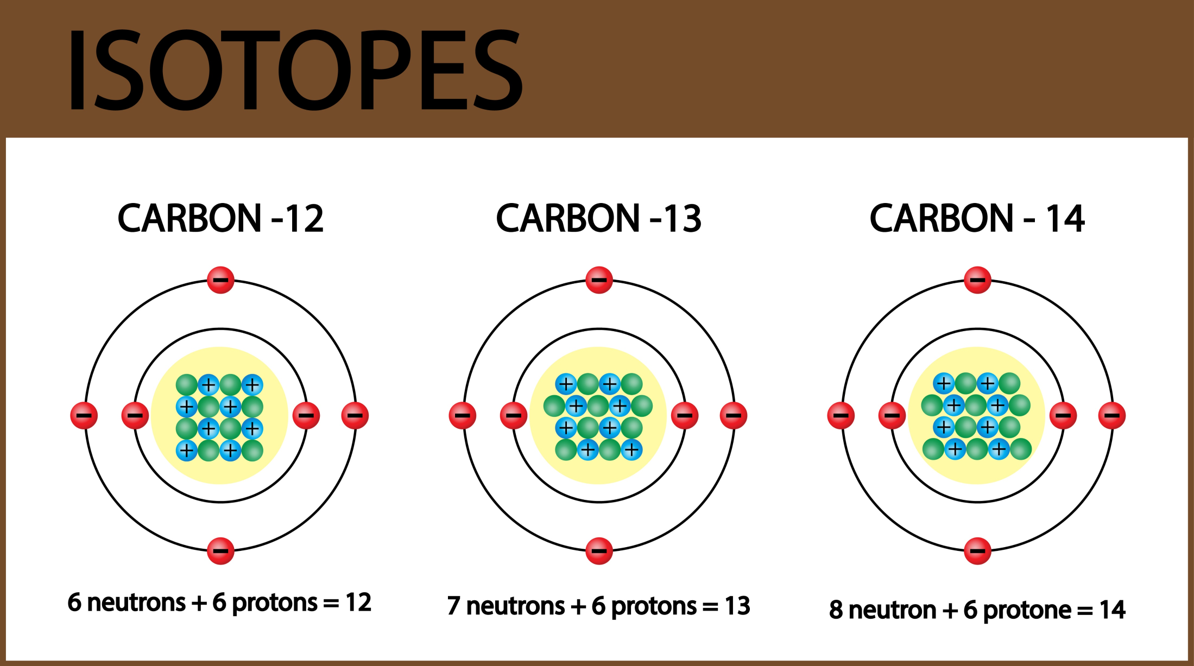
- Understand the meaning of the following terms/concepts and be able to identify examples of each: element, isotope, radioactive, radioactive isotope, stable isotope, parent isotope, daughter isotope, probability of decay of a radioactive isotope, half-life of a radioactive isotope.
- Understand why some isotopes are stable and others are radioactive and why some radioactive isotopes decay more quickly than others.
- Determine the number of half-lives that have passed, given the proportion of parent and daughter atoms. Also, identify the proportion of parent and daughter atoms and the number of half-lives that have passed, given a point on the radioactive decay curve. Finally, determine the radiometric age of a specimen, given the number of half-lives that have passed.
- Know Earth’s age and why humanity’s confidence in this age is high.
Scientific Terms/Concepts
Terms: Element, Isotope, Radioactive, Radioactive Isotope, Stable Isotope, Parent Isotope, Daughter Isotope, Probability of Decay of a Radioactive Isotope, Half-life of a Radioactive Isotope.
Define and give an example of each term:
Term:
Element
Definition:
Example:
Term:
Isotope
Definition:
Example:
Term:
Radioactive
Definition:
Example:
Term:
Radioactive Isotope
Definition:
Example:
Term:
Stable Isotope
Definition:
Example:
Term:
Parent Isotope
Definition:
Example:
Term:
Daughter Isotope
Definition:
Example:
Term:
Probability of Decay of a Radioactive Isotope
Definition:
Example:
Term:
Half-life of a Radioactive Isotope
Definition:
Example:
Stability vs Radioactivity
To have a better understanding of radioactivity, spend at least 5 minutes with the following simulation. Note the speed of decay between the different isotopes.
Radioactive Dating GameRadiometric Dating & Half-Lives
To illustrate how radiometric dating and half-lives work, you will need to find 100 pieces of something with two sides. Some examples would be M&Ms, Skittles, or coins. For the purposes of this activity, we will demonstrate using mini M&Ms, but feel free to use whatever you have access to for yourself.
- First, count out 100 of the items you will be using for this activity. It is simple to do if you make 10 piles of 10.
- Next, take all of your candies and put them in your hand, and then drop them. They should land in a random order.
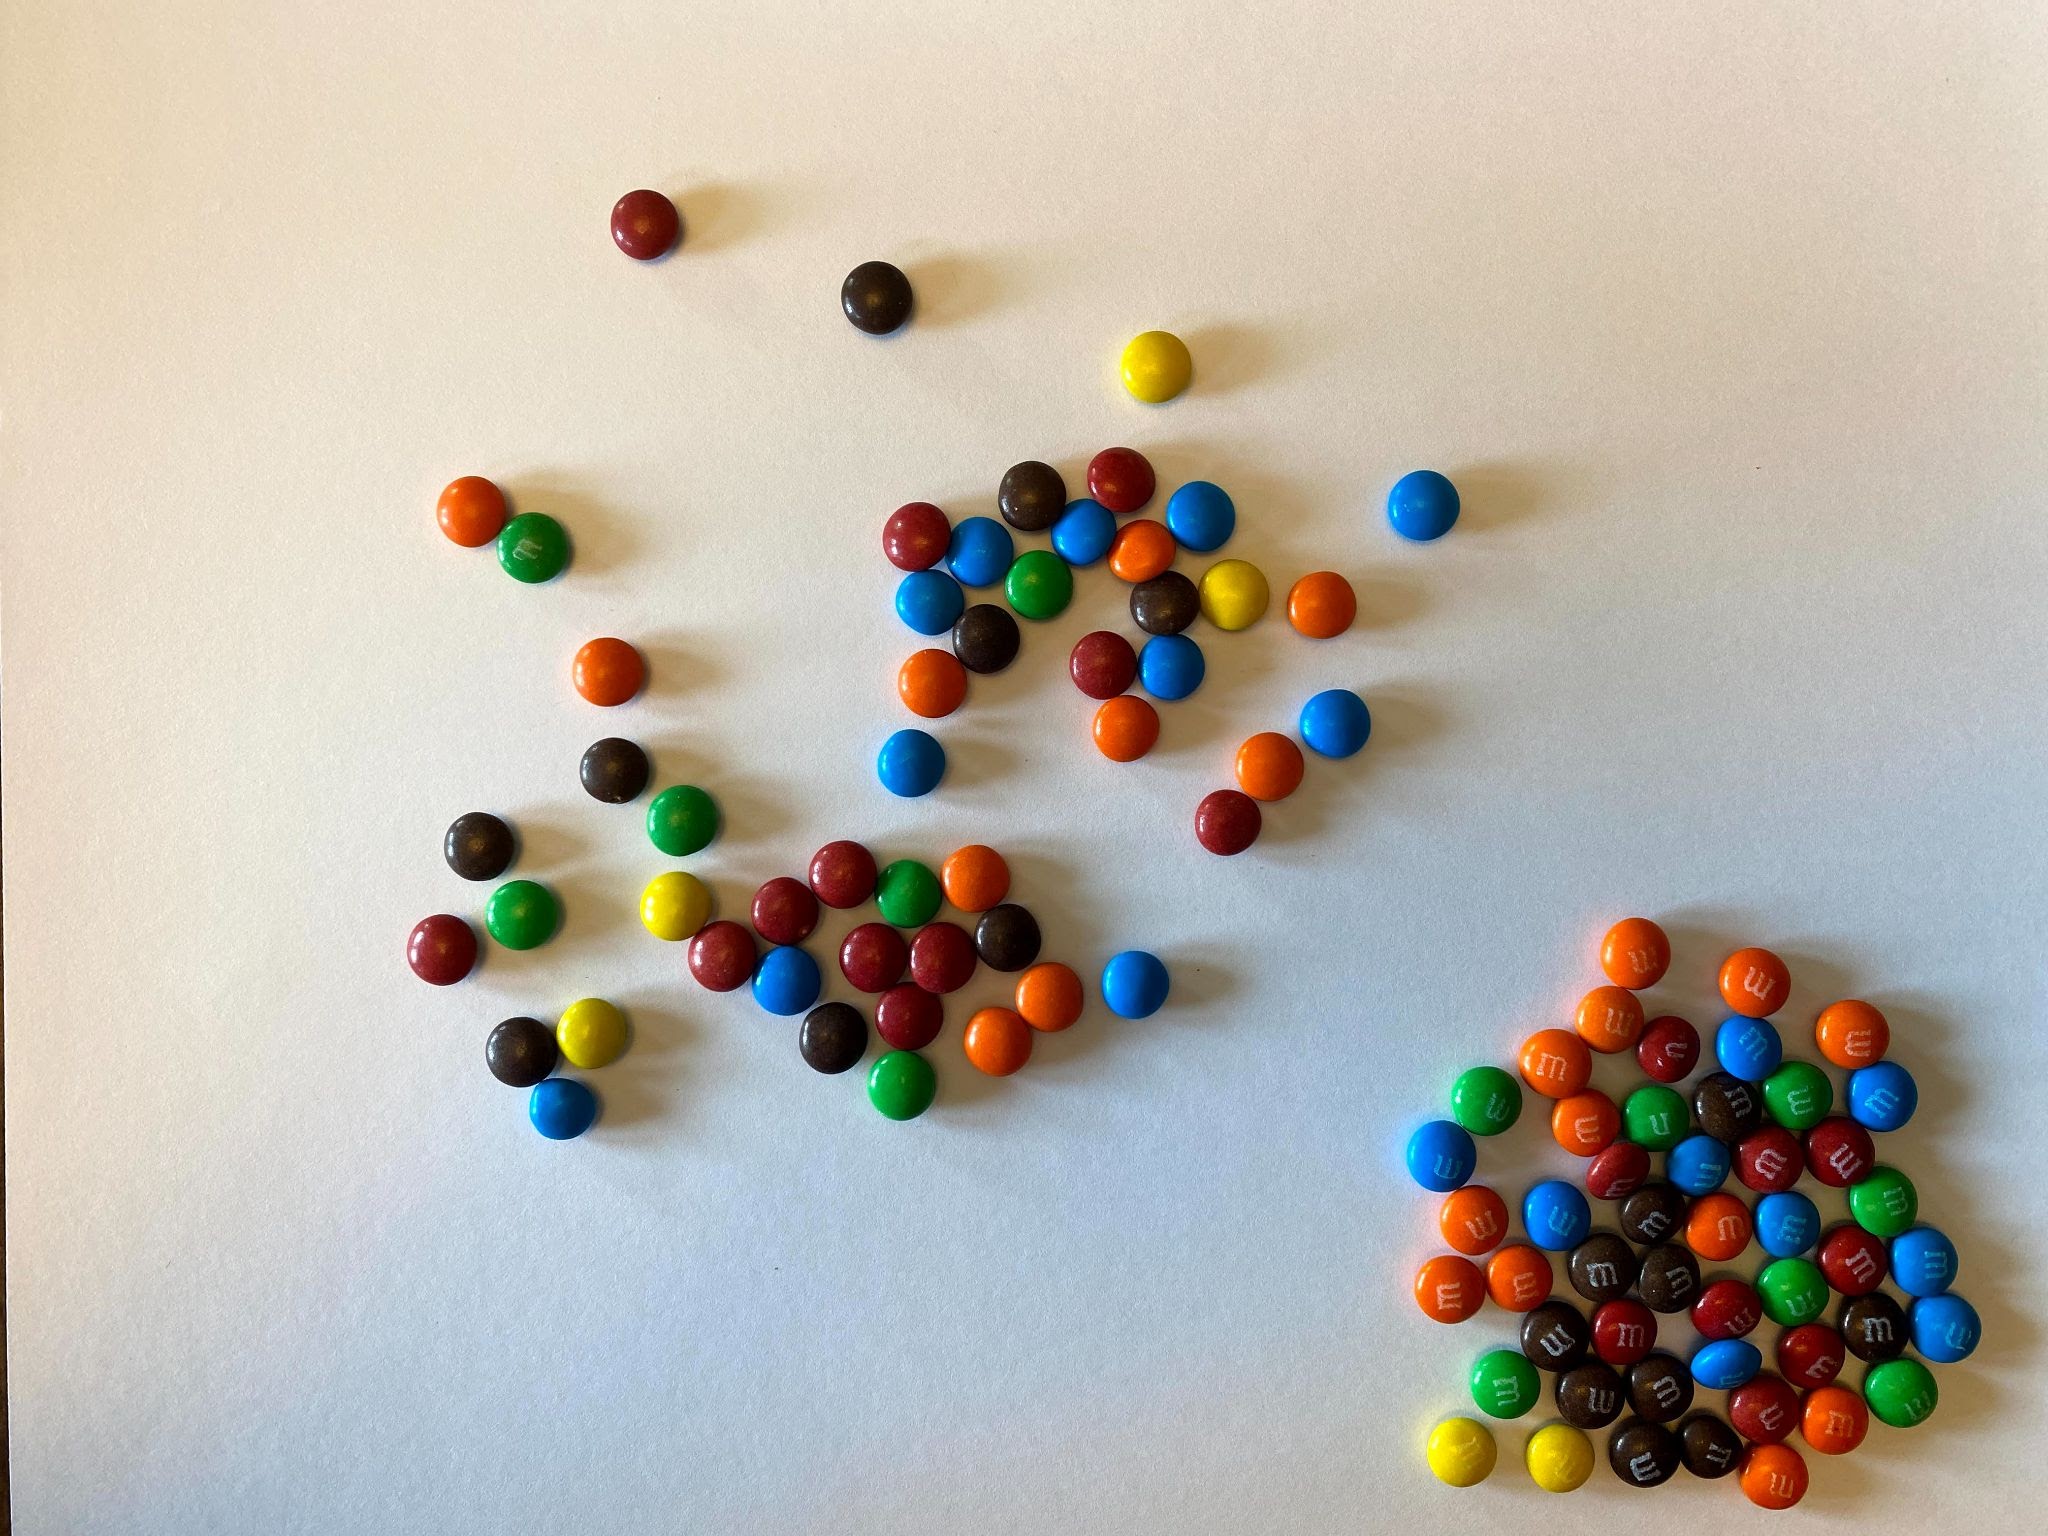
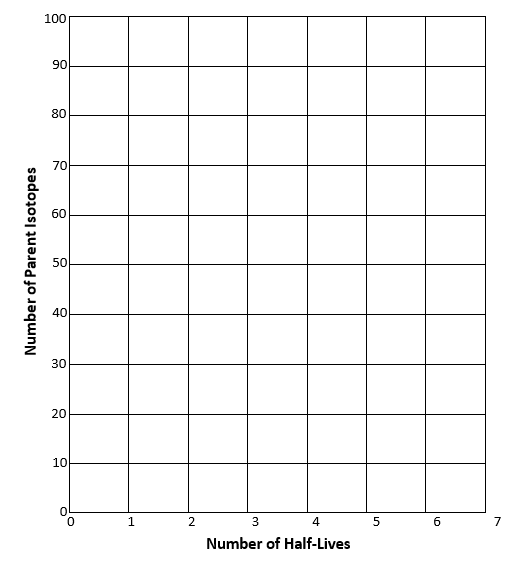
- What we just saw illustrates one half-life elapsing. If we separate our solid candy from our M candy, we can see that we have 52 parent isotopes (solid candy), and 48 daughter isotopes (logo candies). We graphed below what our results looked like on Graph A. Screenshot and graph your results on Graph B.
- Let’s continue with our experiment. Remember that the daughter atoms or isotopes are now stable and will no longer decay. Remove those M&Ms from the pile. Then pick up the remaining parent isotopes and drop them again.
- Continue to remove the daughters and re-drop the parent isotopes until you are left with only one or two parents. Graph your results as you move along.
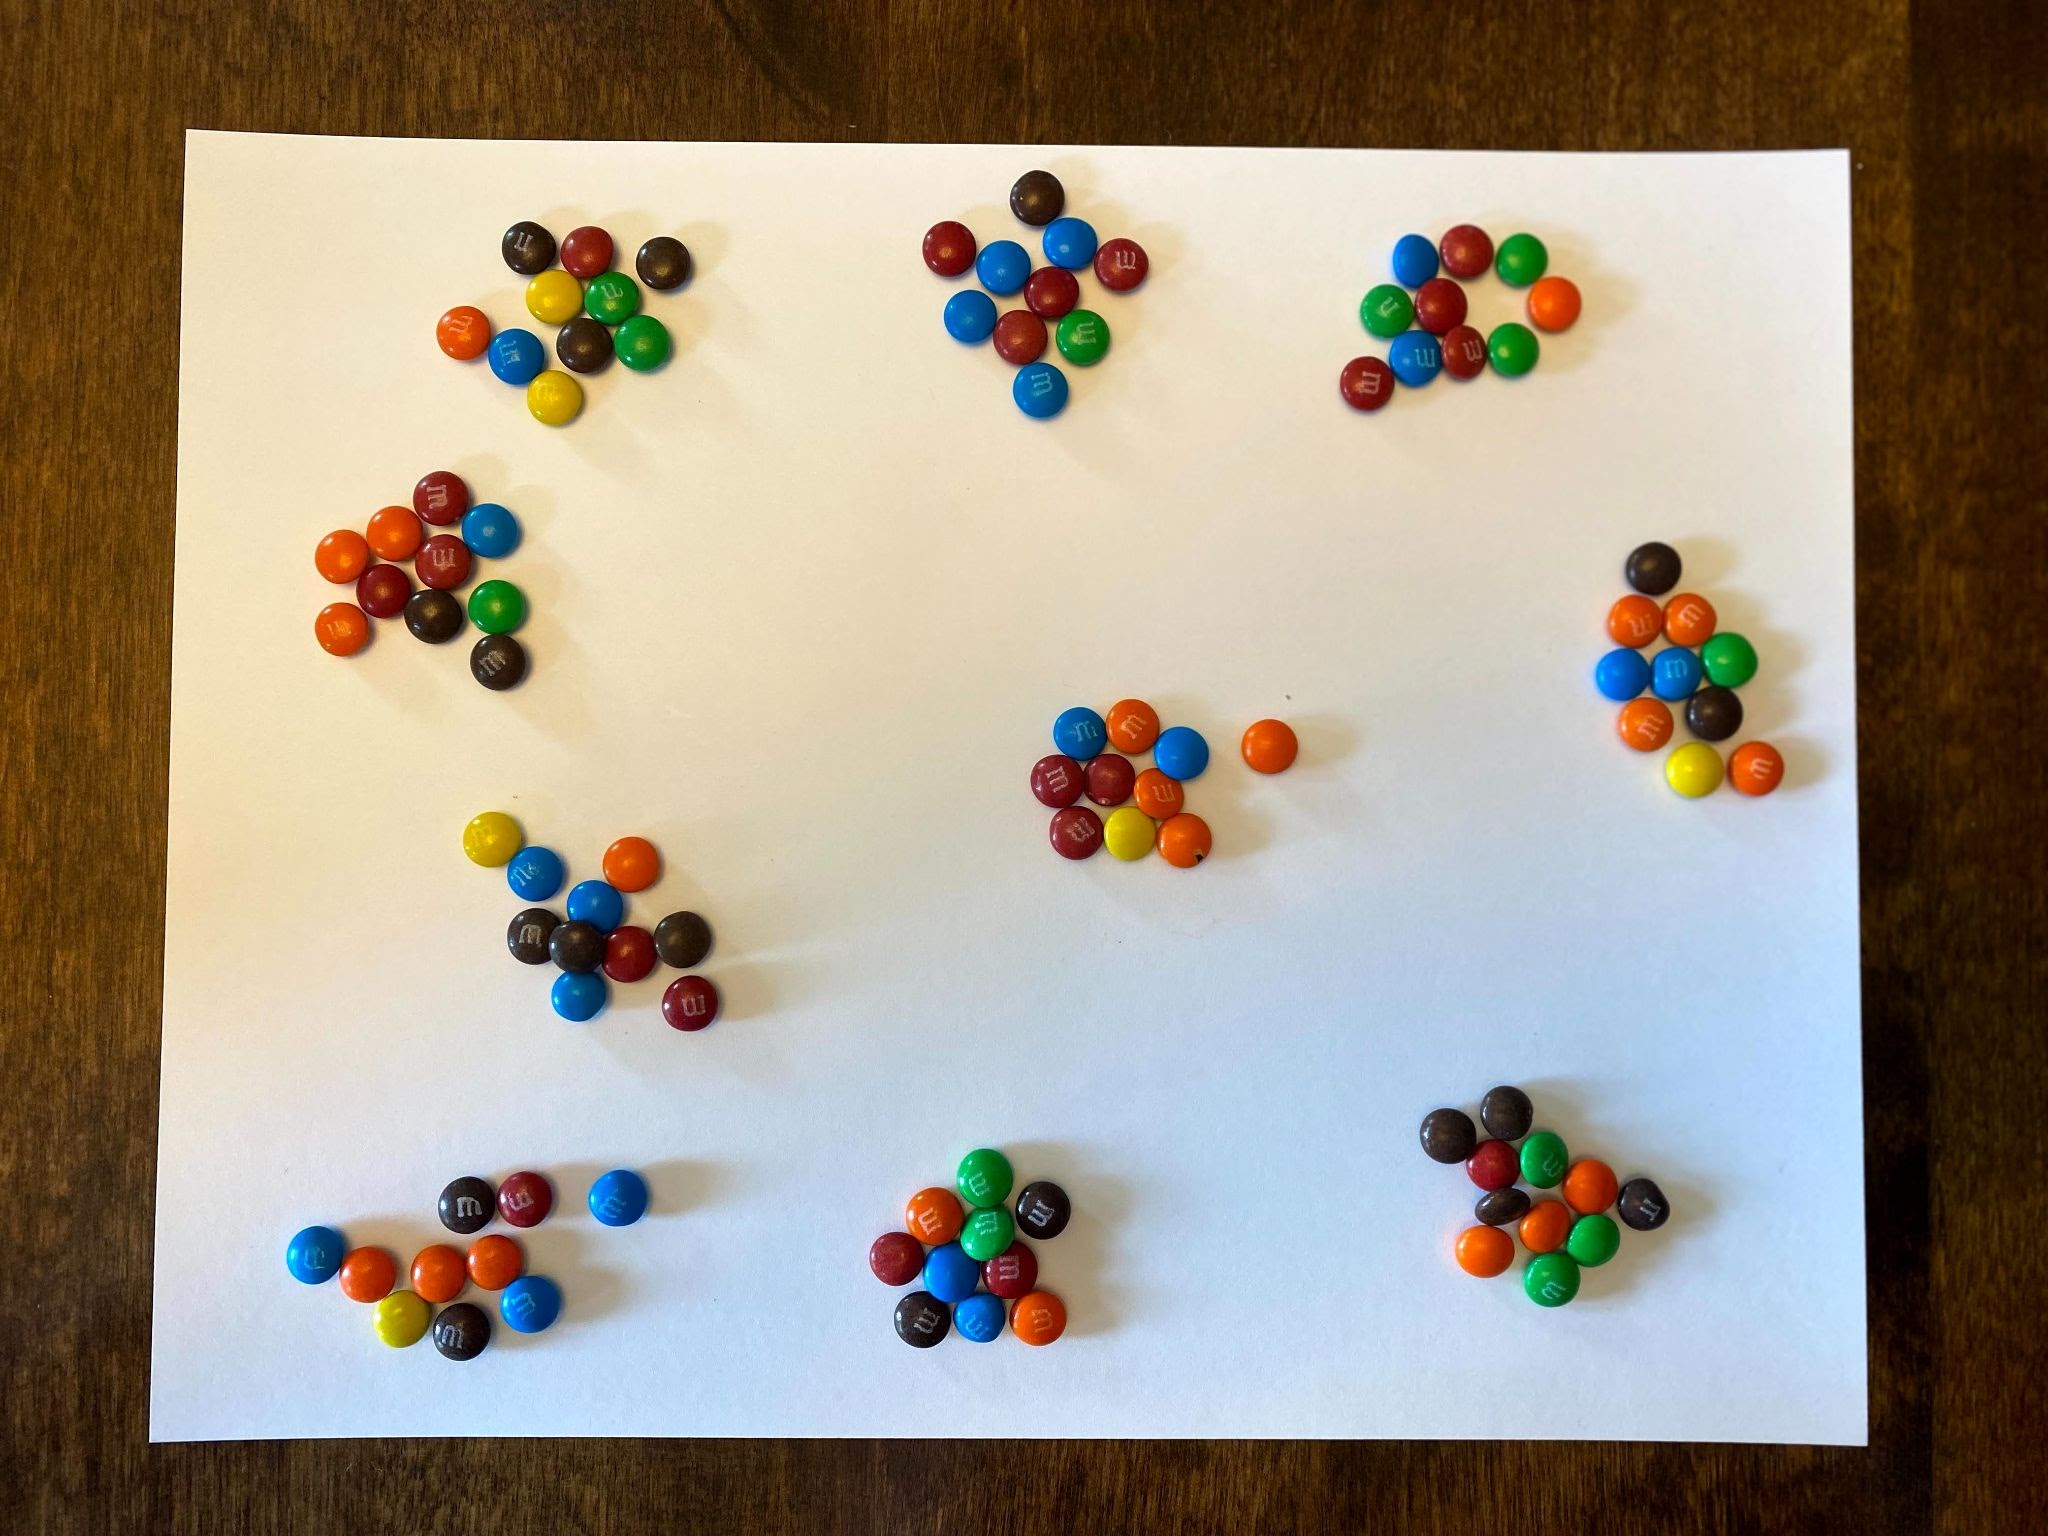
For the purposes of this activity, we are going to say that these candies represent radioactive isotopes. Let’s call them Carbon-14.

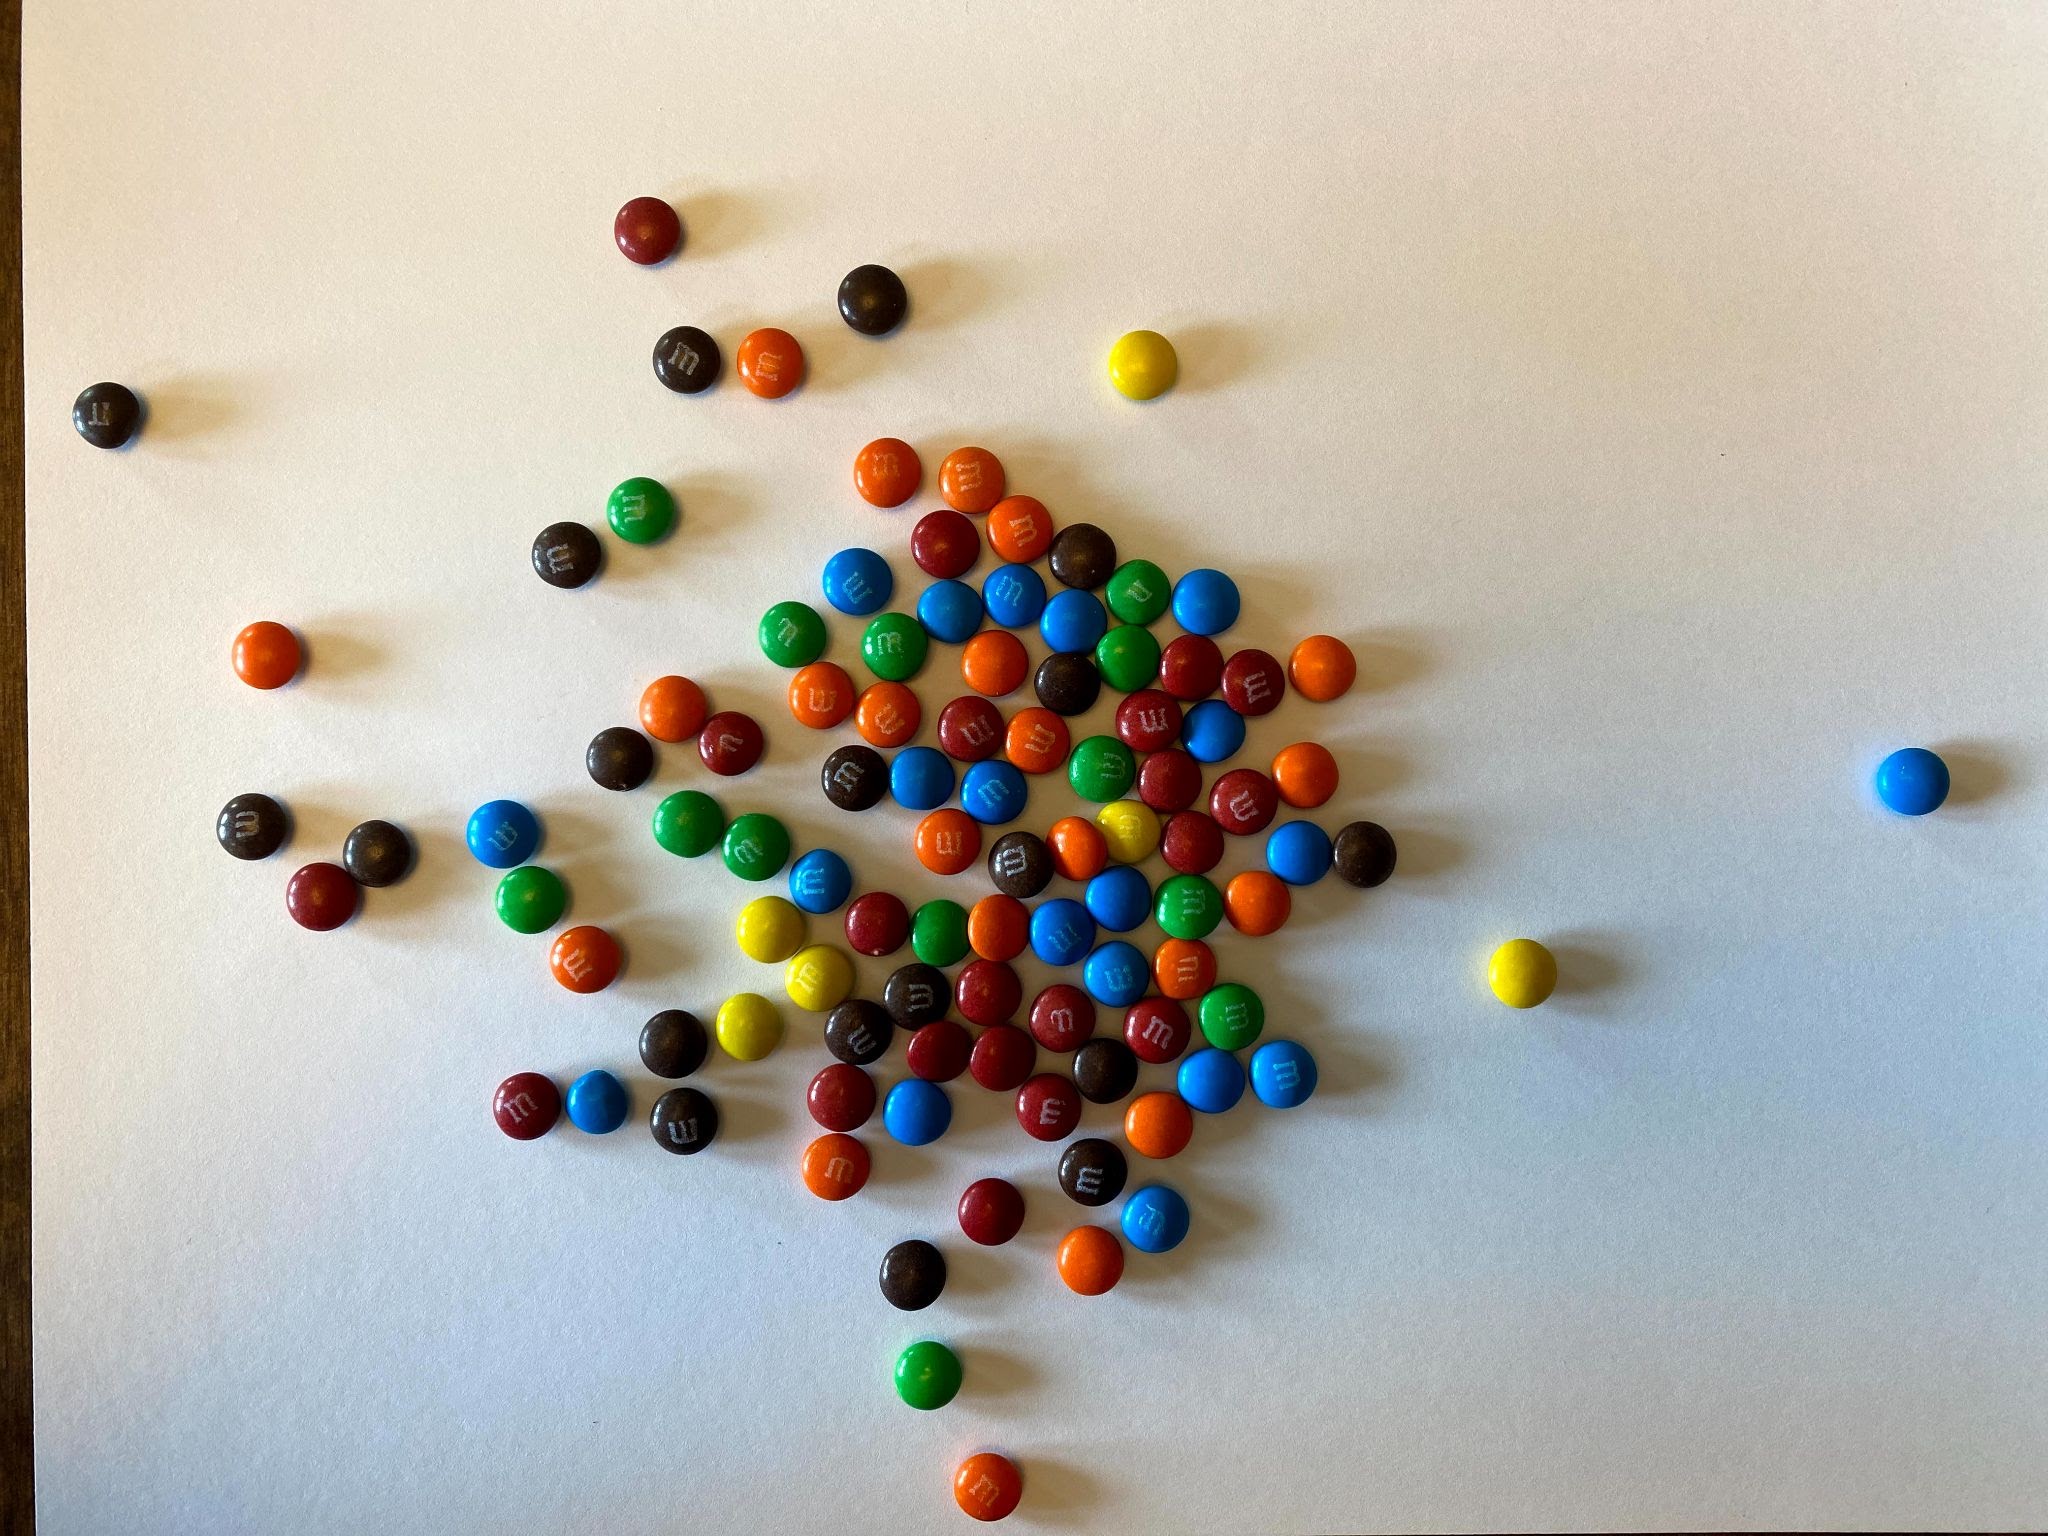
As you can see from the above image, some of the M&Ms landed with the solid side up, and some landed with the logo side up (in this case, the letter M). If these candies represent Carbon-14, we will say that the M&Ms that landed solid-side up are still radioactive and remain Carbon-14. We will call these the Parent Atoms or the Parent Isotopes. The M&Ms that land with M-side up are now decayed into Nitrogen-14 and have become stable. These are the Daughter Isotopes and will no longer decay.
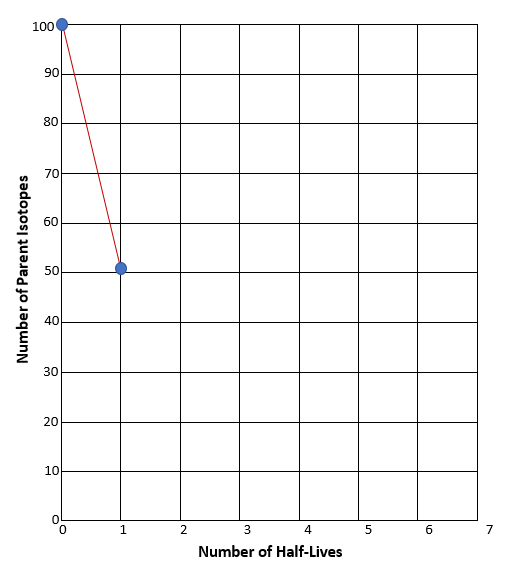
As you can see, this example isn’t perfect. In a perfect example, exactly 50% of the isotope would have decayed. But in our example, only 48% of the isotope decayed. Your experiment may have been the same as the example, or it may have been exactly 50%, or it may have been different than both of those examples.
What would explain why a radioactive isotope would decay at a different rate than exactly half in one half-life?
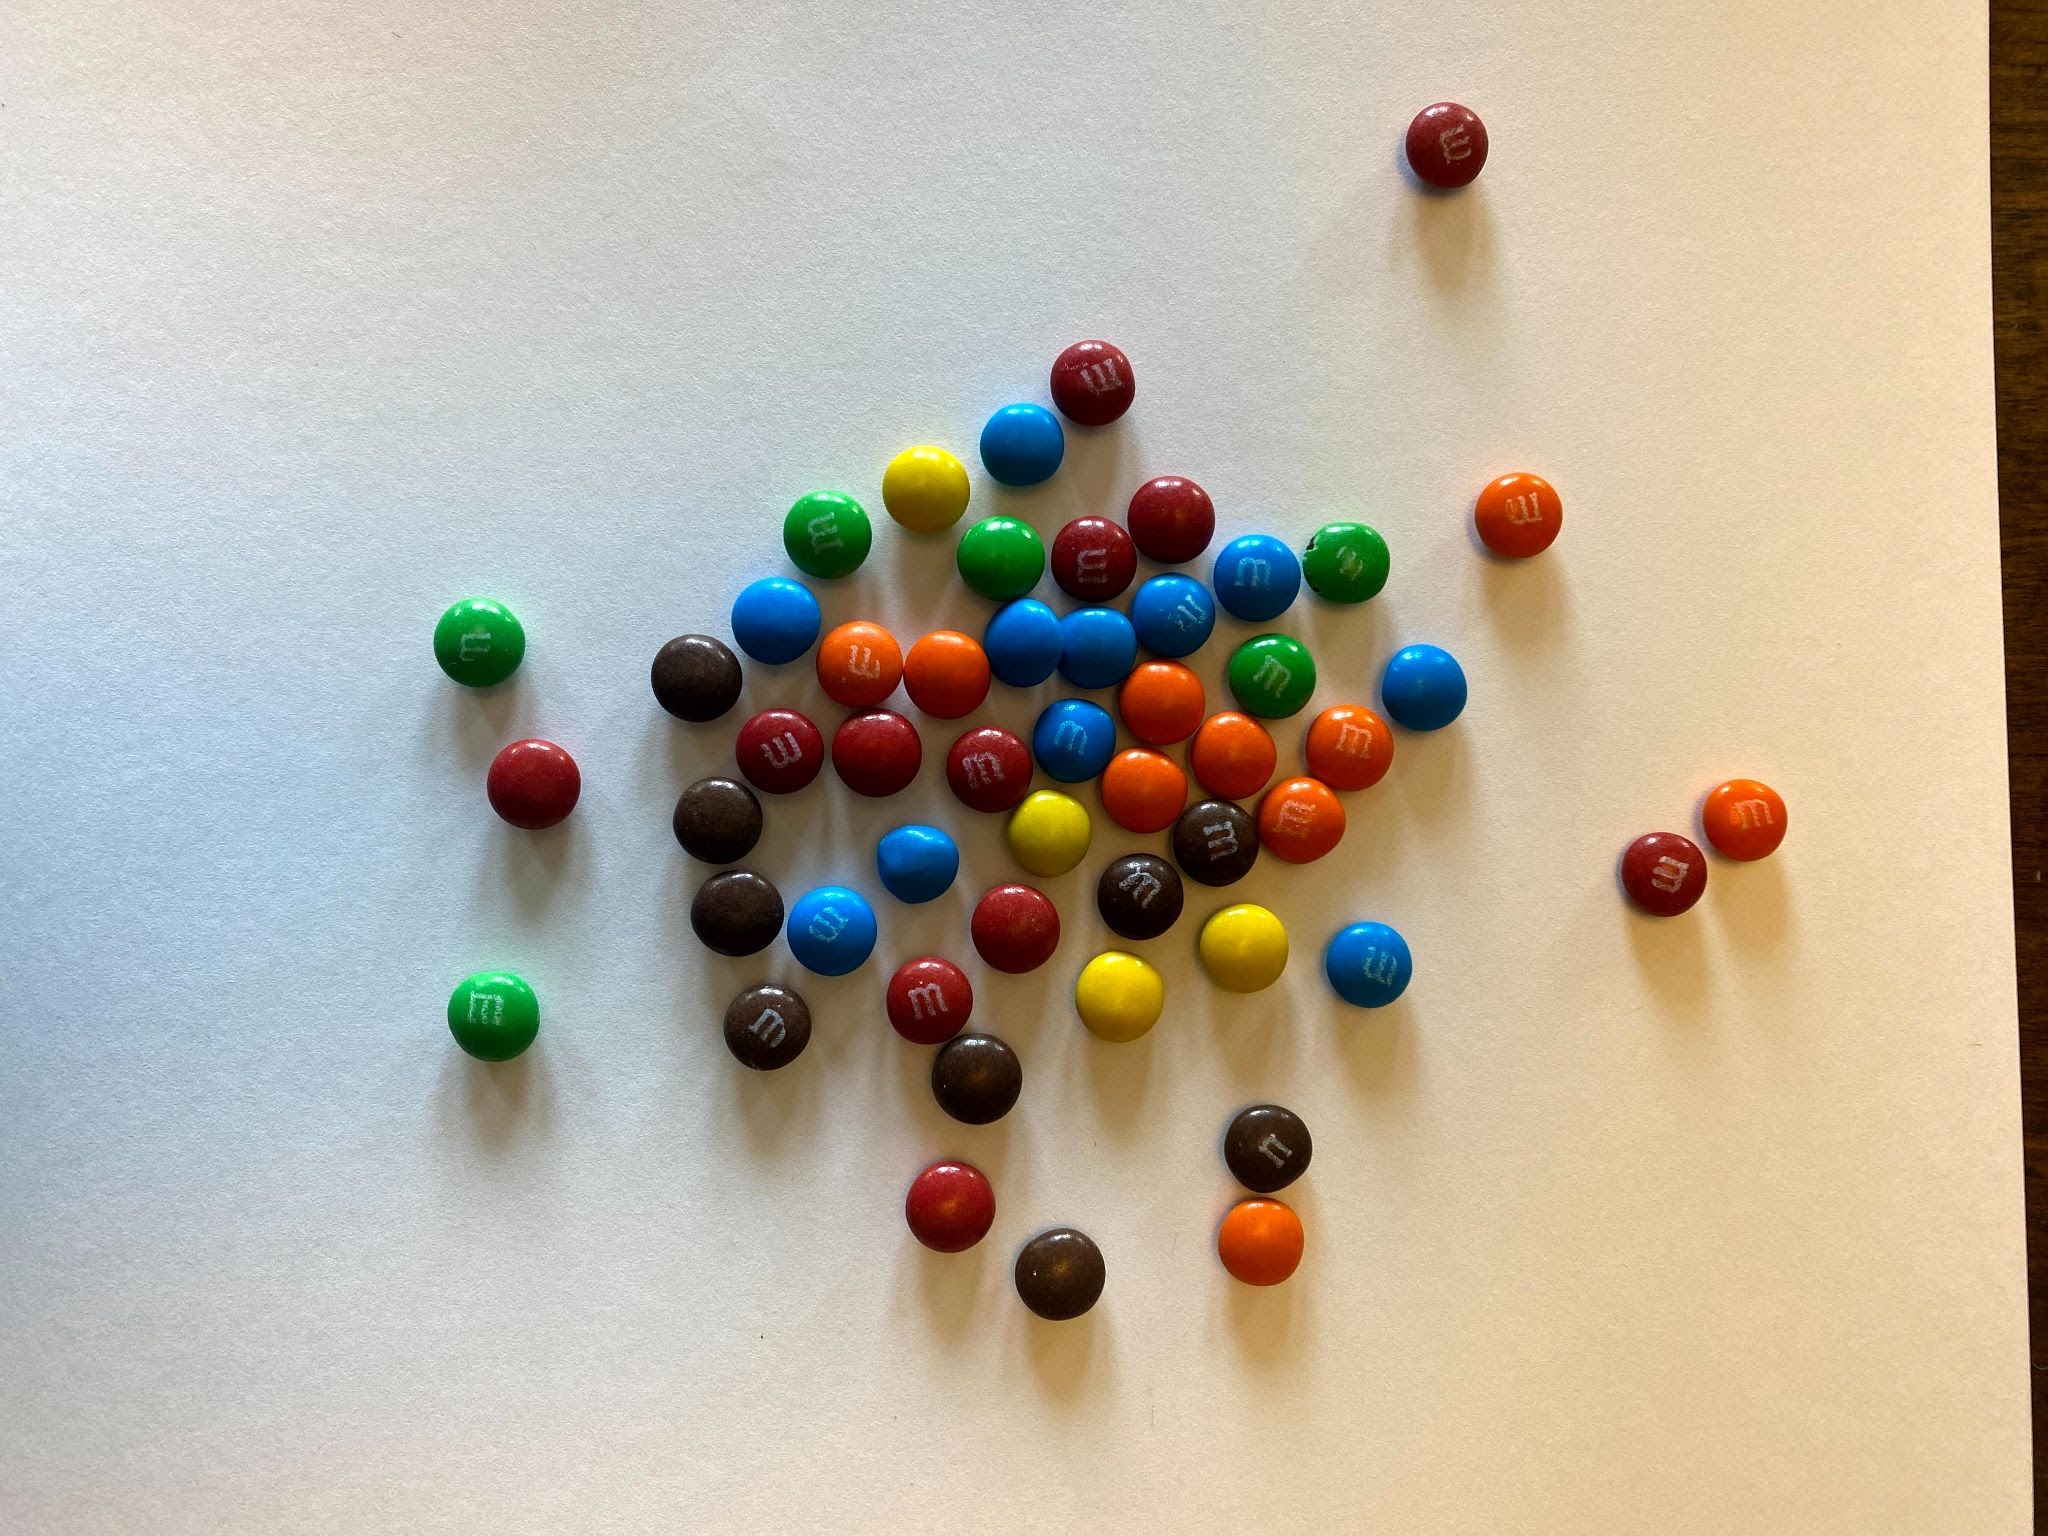
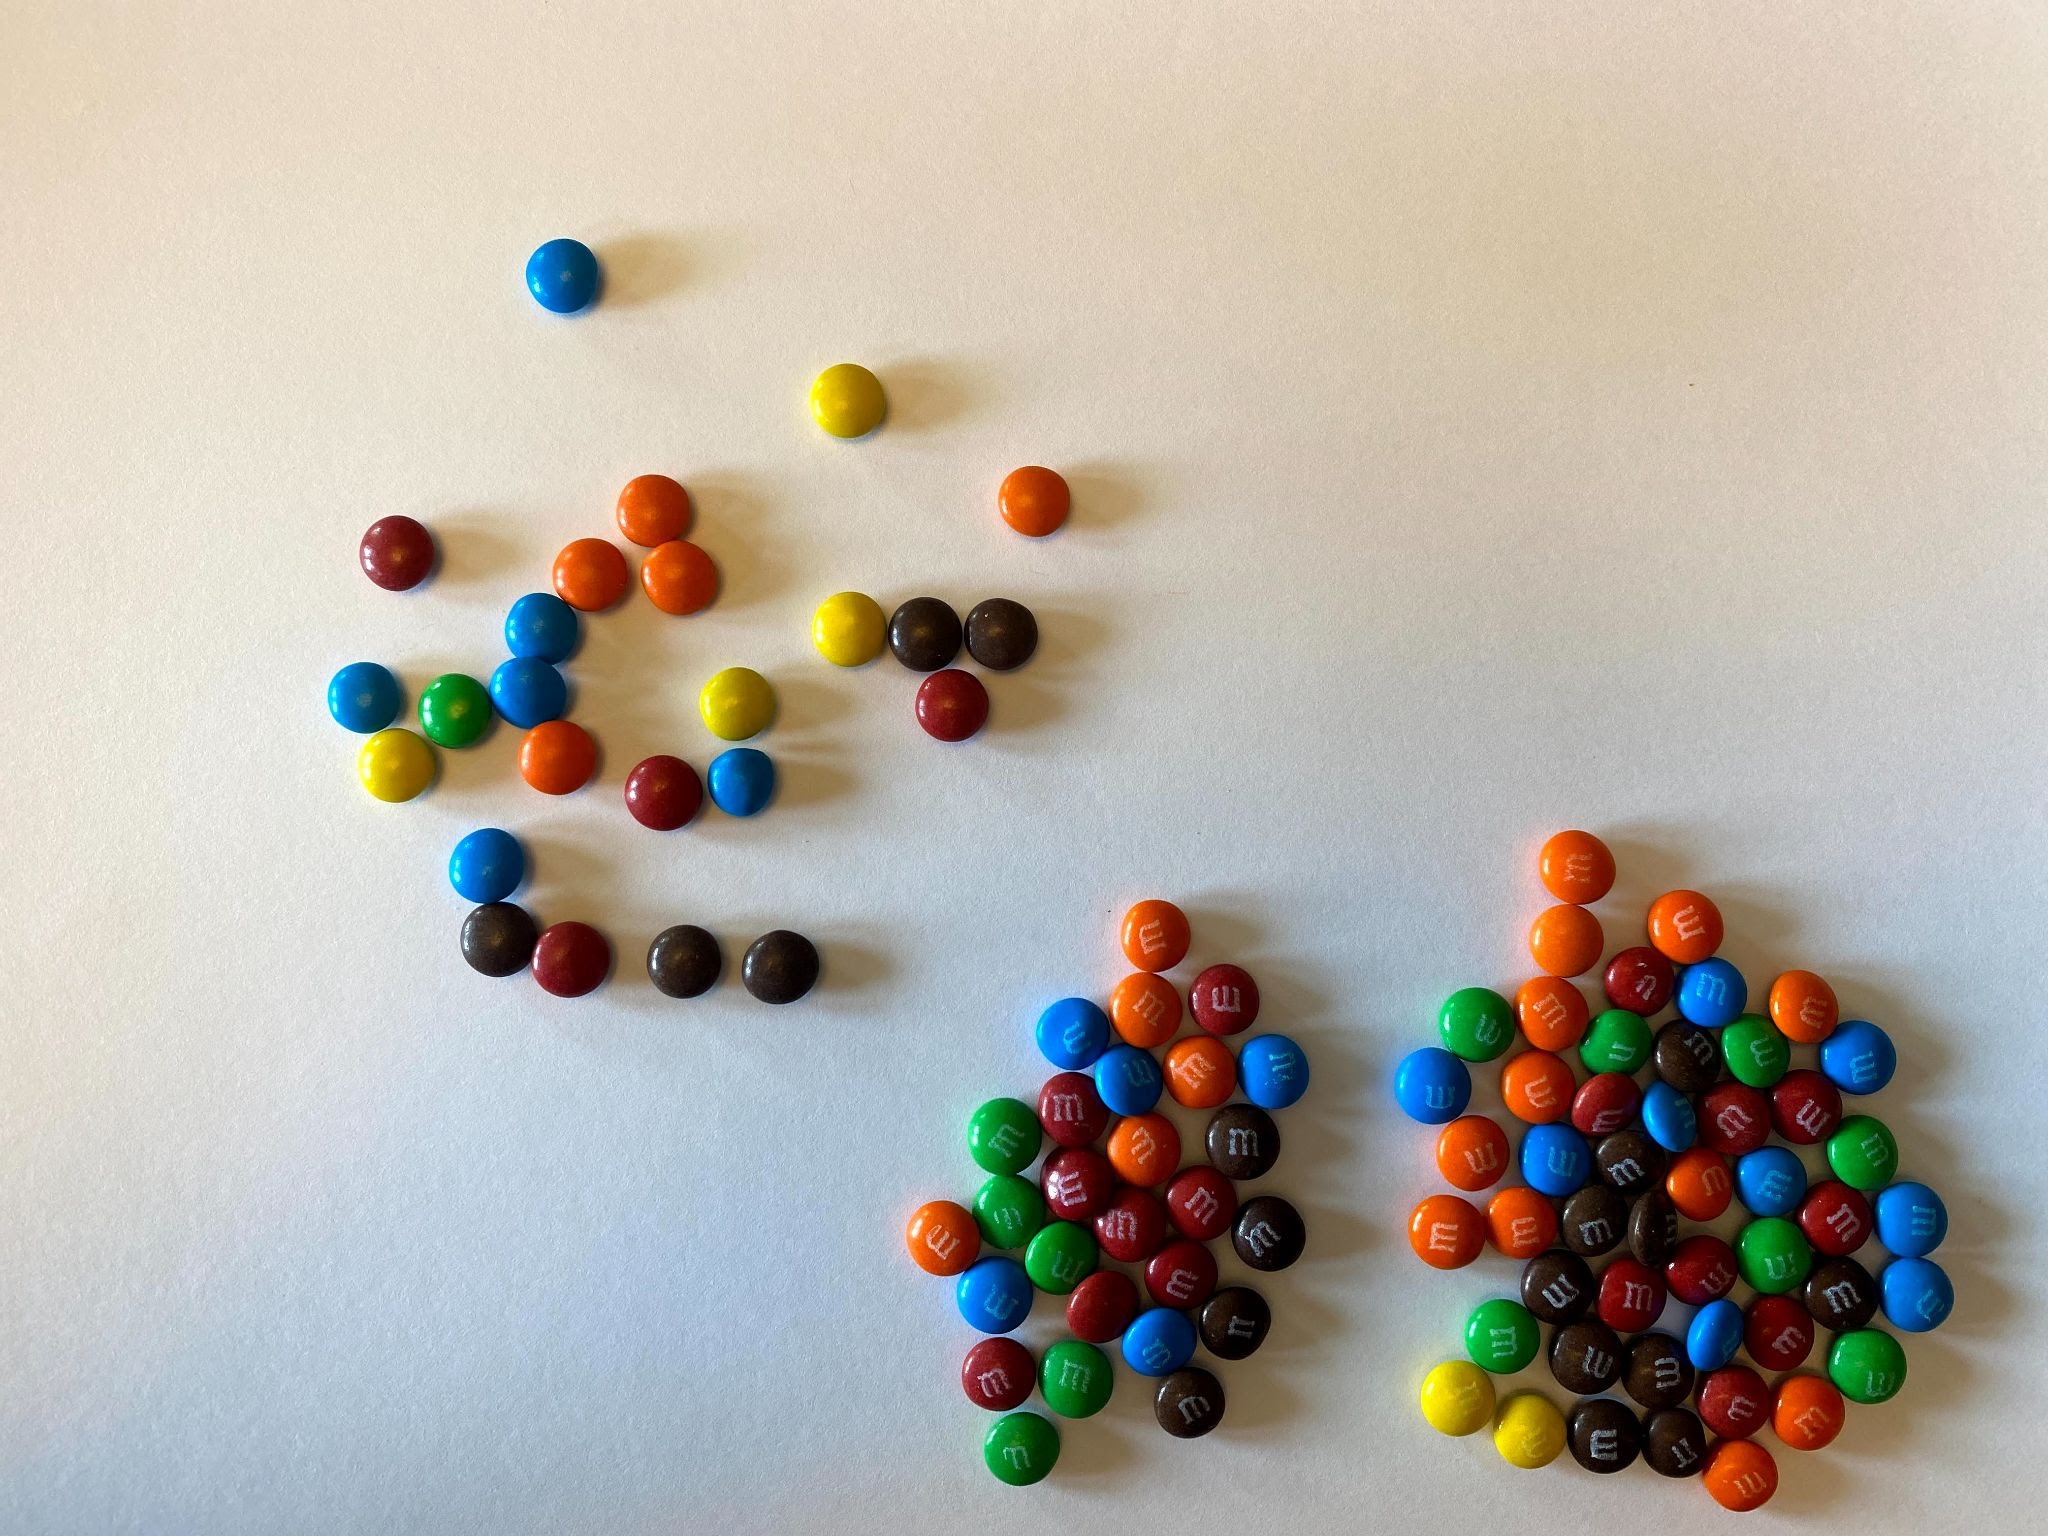
Now remove the daughters again and count how many parent isotopes remain. Now two half-lives have elapsed. Observe the example results on Graph C and then chart your own results on Graph B above.
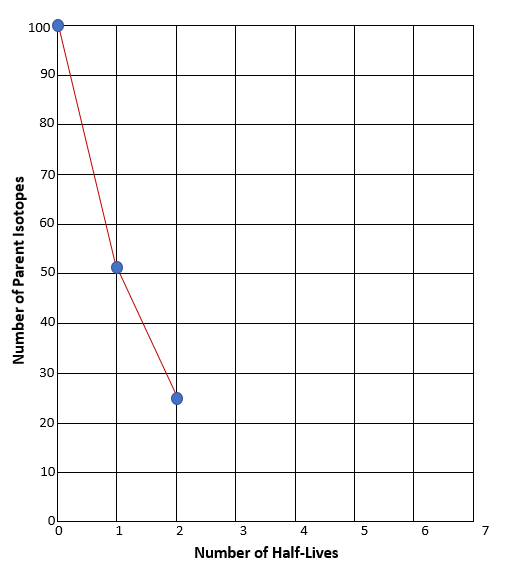
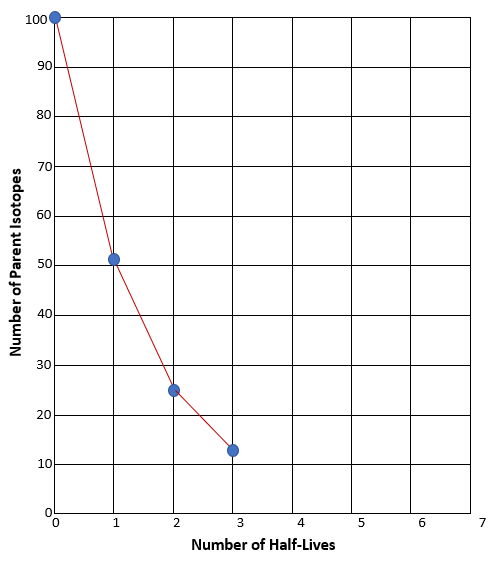
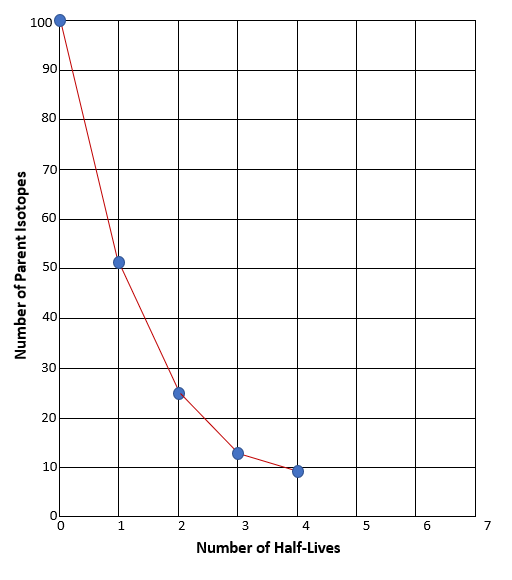
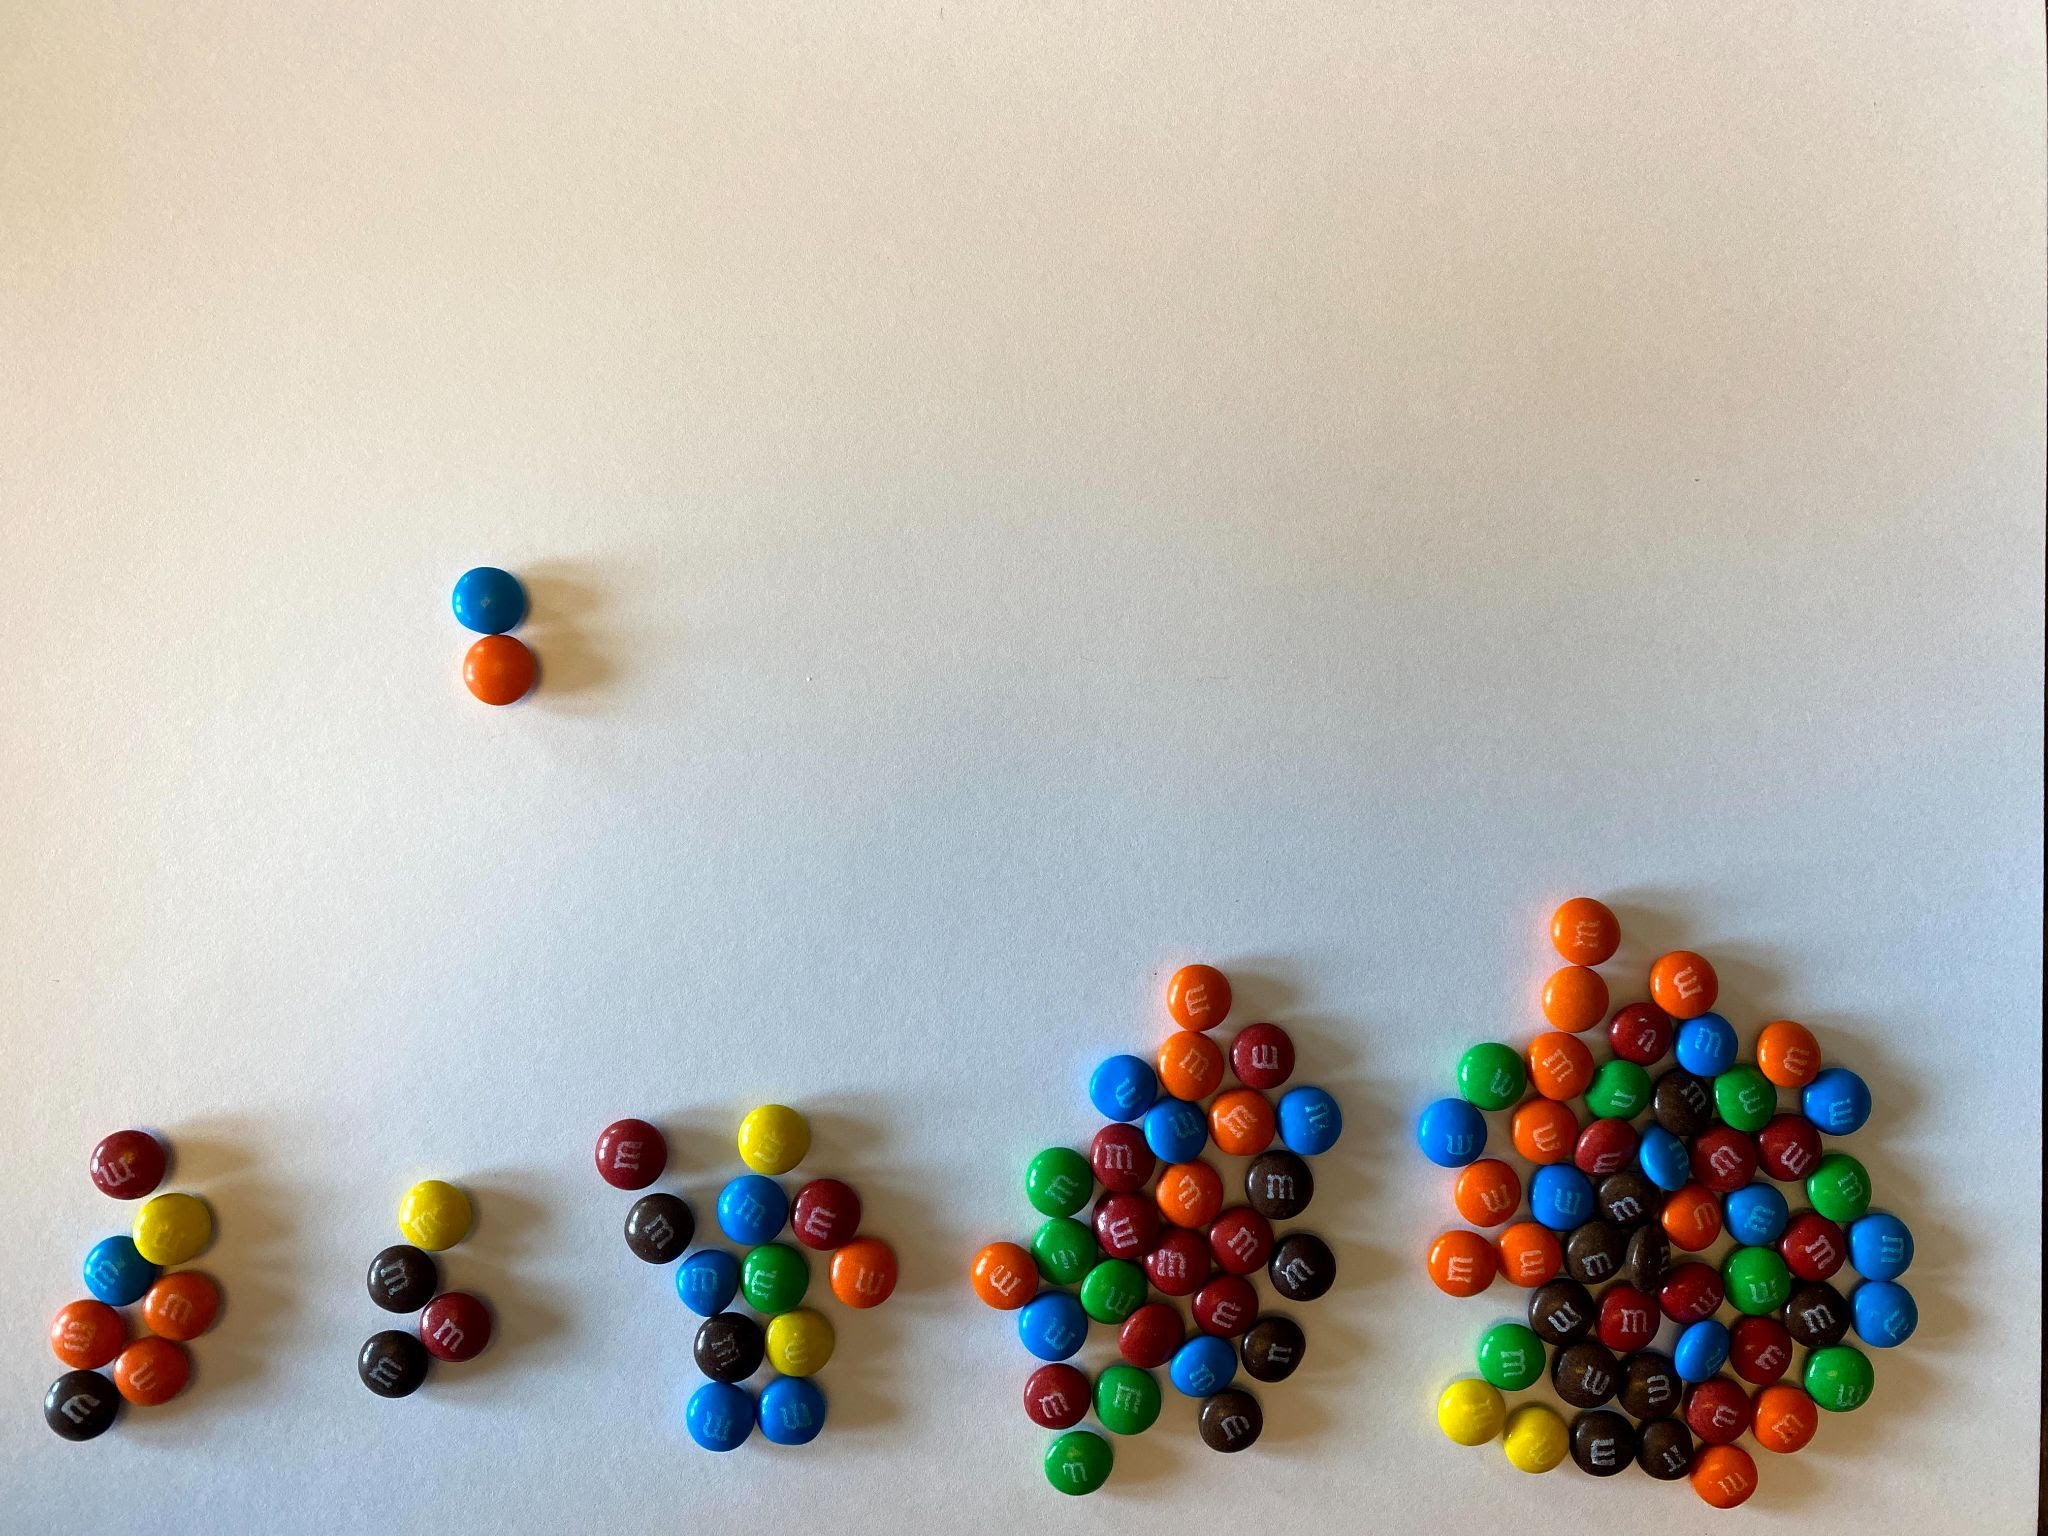
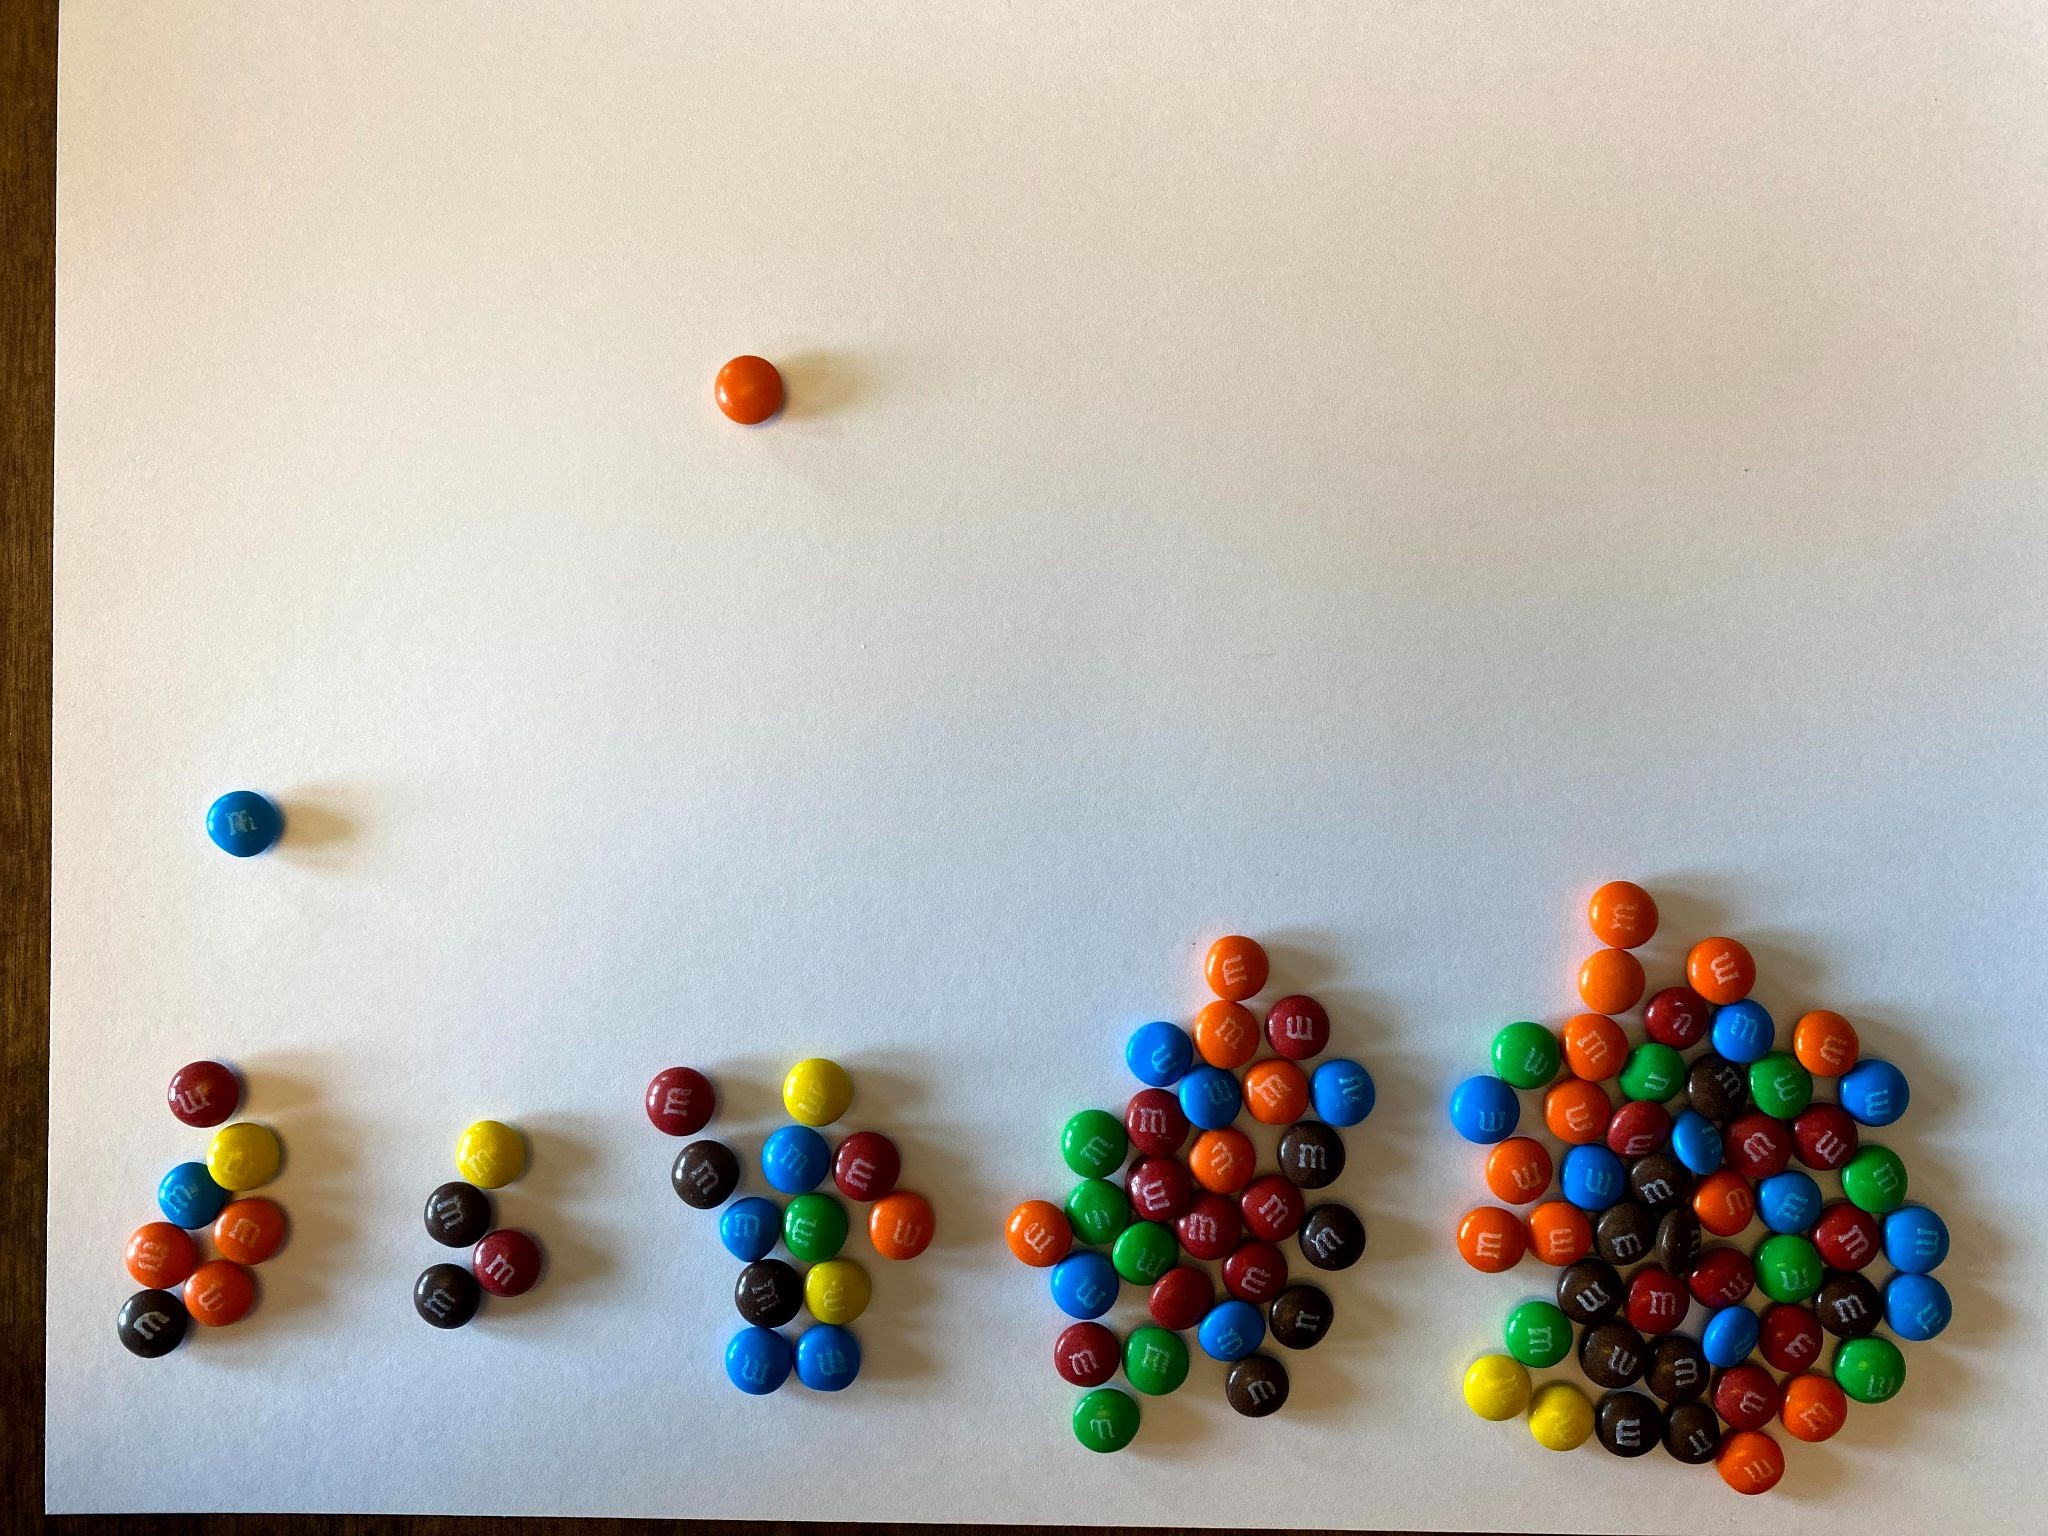

The graph you made should have a downward slope, similar to the example graph. But remember, if we were actually using Carbon-14, instead of candy, the slope would be much more precise. You would expect it to look smooth like this:
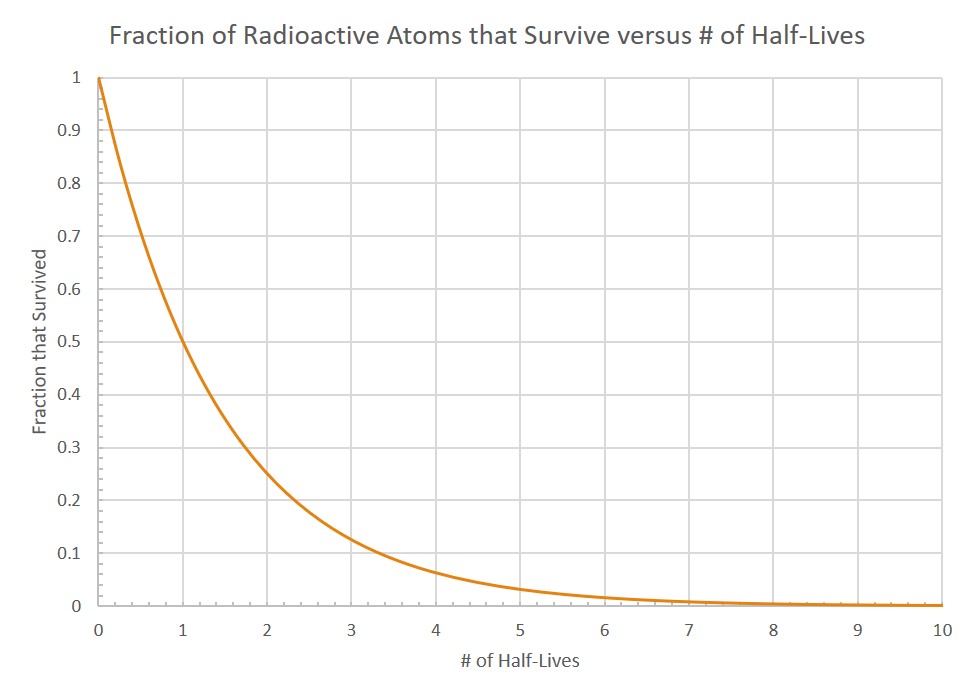
Notice that the plot has the characteristic decay shape and accurately predicts the relationship between half-lives and the fraction of atoms that survived (didn’t decay). For example, note that after one half-life, 0.5 (half) of the radioactive parent atoms remain. And then, after each subsequent half-life, half of what was left after the previous half-life remains.
Age Of Earth
Watch this video (7.5 minutes) that shows how radiometric dating works and why it helps us determine the age of the Earth.
("Radiometric Dating" Transcript)

