Explore 2.7 What Light Can Teach Us & How We Learn It
Learning Objectives
By the time you have completed the 2.7 Introduction & Exploration Activities, you should be able to:
- Understand the meaning of the following terms/concepts and be able to identify examples of each: wavelength, amplitude; color, brightness, position, and spectrum (continuous, emission, absorption) of an astronomical object; doppler effect, blueshift, redshift, parallax.
- Illustrate how important scientific interpretations about the universe, stars, etc. are derived from scientific observations of the position, color, spectrum, and brightness of astronomical objects using the following examples:
- How stellar temperatures are derived from observations of star color.
- How distances to astronomical objects can be determined from observations of parallax and by comparing the true and apparent brightness of an object.
- How the elemental composition of astronomical objects can be determined from observations of their spectra.
- How the motion of astronomical objects (away from, towards, or rotation) can be determined from observations of the blue-shift or red-shift of their spectra.
- When humanity observes light from an astronomical object such as a star or galaxy, what does the distance to the object indicate about the age of the light?
Scientific Terms/Concepts
Terms: wavelength, amplitude; color, brightness, position, and spectrum (continuous, emission, absorption) of an astronomical object; doppler effect, blueshift, redshift, parallax.
Define and give an example of each term:
Term:
Wavelength
Definition:
Example:
Term:
Amplitude
Definition:
Example:
Term:
Color
Definition:
Example:
Term:
Brightness
Definition:
Example:
Term:
Position
Definition:
Example:
Term:
Spectrum
Definition:
Example:
Term:
Continuous Spectrum
Definition:
Example:
Term:
Absorption Spectrum
Definition:
Example:
Term:
Emission Spectrum
Definition:
Example:
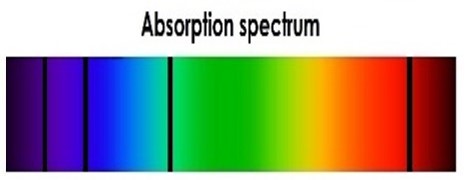
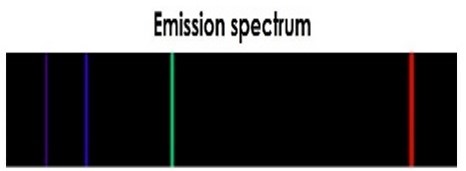
Special note: As you can see, emission and absorption spectra are complementary: the dark lines in absorption spectra (on a continuous background) are equivalent to the bright lines in emission spectra (on a black background).
Term:
Doppler Effect
Definition:
Example:
Term:
Blue Shift
Definition:
Example:
Term:
Red Shift
Definition:
Example:
Term:
Parallax
Definition:
Example:
Observing & Interpreting the Color, Position, & Brightness of Stars
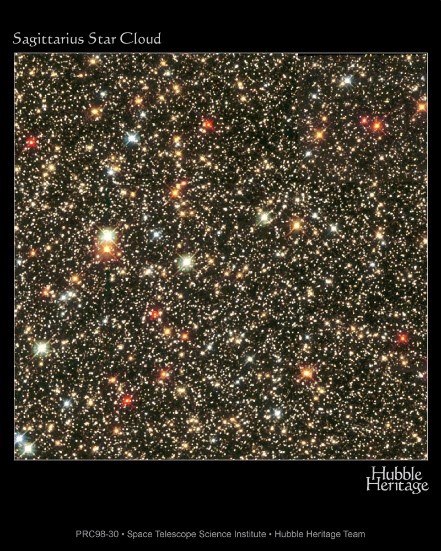
Next week's Enrichment Activity (W04) involves observing the stars. If you complete this Activity during the summer or early fall, you'll compare the stars Vega and Antares. Vega is almost pure white, with a tinge of blue, and Antares is reddish. If you complete the Activity during Winter or early Spring, you'll contrast Betelgeuse and Rigel, the two bright stars in the constellation Orion. Rigel is blue, and Betelgeuse is red. Stars come in a variety of colors!... as illustrated in the following Hubble Space Telescope photograph of the Sagittarius star cloud.
Interpreting Temperature from Observations of Color
To help you develop your intuition about the connection between color and temperature, watch this video (<1 min) of an incandescent light bulb that changes color and brightness as temperature changes. As you watch, you'll see the color and brightness change as Dr. Tonks adjusts the temperature of the bulb by changing the voltage. First, we increase the temperature (by increasing the voltage from 100% to 120%), and then we decrease temperature slowly (by changing the voltage slowly downward, eventually to 0%). To help illustrate the change in color, look at the 7 photos below, in which temperature decreases from upper-left to lower-right. (Note, the images of the bulb are out of focus to emphasize the color.)
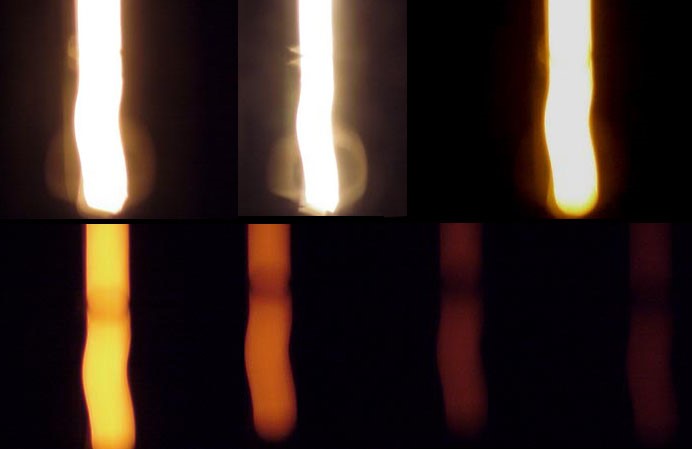
Use the video and images to answer the following questions:
1. Describe what happened to the brightness as the temperature decreased.
2. Describe what happened to the brightness as the temperature increased.
3. Describe what happened to the color as the temperature decreased.
4. Describe what happened to the color as the temperature increased.
Now that you've deepened your intuition about the relationship between color and temperature, look back at the Sagittarius star cloud picture above and answer the following questions:
1. Which star color represents the hottest stars in the image?
2. Which star color represents the coolest stars in the image?
Interpreting Distance from Observations of Position
Watch this video (1:58 min) to learn about stellar parallax and measuring distance. Recall that position is one of the fundamental observations we can make of stars and other astronomical objects. By itself, position tells us where a stars is located, but otherwise has little meaning. However, measuring the apparent changes in the star’s position over time (parallax) is very meaningful. Parallax—the apparent change in the position of a star relative to other stars—is a result of Earth’s orbit around the Sun, as illustrated in the figure below (which you saw in the Introduction Activity).
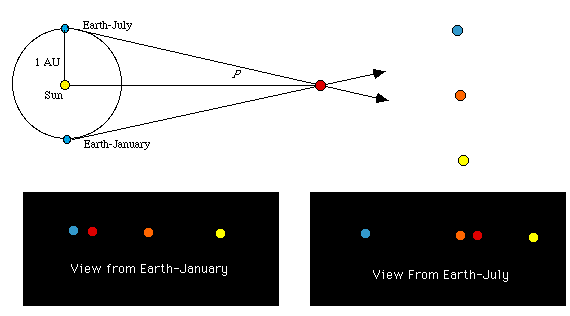
Locate the 'red' star in the diagram above. Consider how the parallax would change if the 'red' star were nearer to or more distant from Earth. Using your knowledge of parallax, answer this question:
Would parallax increase or decrease if the star were nearer to Earth than in the diagram?
Interpreting Distances & Sizes from Observations of Apparent Brightness
After establishing straightforward relationships between observations and interpretations (such as interpreting temperature from observations of color), more complex relationships between webs of observation and interpretation can be established. The brightness of stars provides a relatively simple example of what could be called 'network' interpretations—scientific explanation that rely on a web of observation-interpretation relationships.
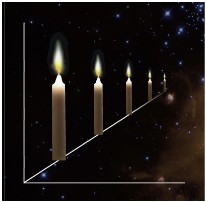
In addition to color, position, and spectrum (discussed below), humanity can directly measure the apparent brightness of a star. Brightness is a measure of how intensely an object shines. The intensity with which a star shines is the total amount of light energy given off by a star in a given amount of time. Astronomers call this property luminosity or true brightness.
So, what properties determine true brightness of stars? The luminosity of stars depends on temperature and size. Earlier we demonstrated in this video (<1 min) that true brightness increases with temperature: the hotter the object the brighter it is. To understand how diameter plays a role, consider two stars of equal temperature but different size. Which will emit more total light energy? Clearly, the larger star—since same-sized pieces of each star emit the same amount of energy, and the larger star has more of those 'pieces'. The effect of size on luminosity is illustrated in this video (22 s). As you watch, Dr. Tonks covers a portion of the light with an opaque tube. Imagine how brightness would continue to diminish if he were to cover ever more of the bulb. Thus, both temperature and size determine the true brightness (luminosity) of stars; that is, large hot stars are brighter than small cool stars.
Unfortunately, humanity cannot measure true brightness directly. We can only measure apparent brightness, the intensity of light produced by a star as observed from Earth. When light leaves the surface of a star, it spreads as it occupies successively larger volumes of space. Although the total light energy produced remains unchanged, the energy along any one light ray diminishes with distance, as illustrated in the dimming of observed (apparent) brightness shown in this video (10 s). This is why the brightness of a flashlight appears to diminish with distance. Thus, although the true brightness remains unchanged, apparent brightness diminishes with distance. In other words, the farther away an object is, the dimmer it appears.
To help you deepen your understanding of these relationships, briefly answer the following three questions.
How does the temperature of a star affect its true brightness (luminosity)?
How does the size of a star affect its true brightness?
How does the distance between Earth and a star affect the apparent brightness of a star?
Observing & Interpreting the Spectra of Astronomical Objects
We hope each of you has seen a rainbow. If not, you ought to get out more often! ;) As most of you know, rainbows form where the Sun's light is split into its component colors. The Sun produces light in all the visible colors of the rainbow as well as significant amounts of ultraviolet light (which is why you get sunburns!) and infrared light. A rainbow is the spectrum of the Sun, and a spectrum is the light from a source broken into its component colors. Spectra are created by passing light through a prism (or similar), as shown in the animation below. Rainbows are created when sunlight passes through the prism-like water droplets (mist) in clouds, the spray from waterfalls or sprinklers, etc.
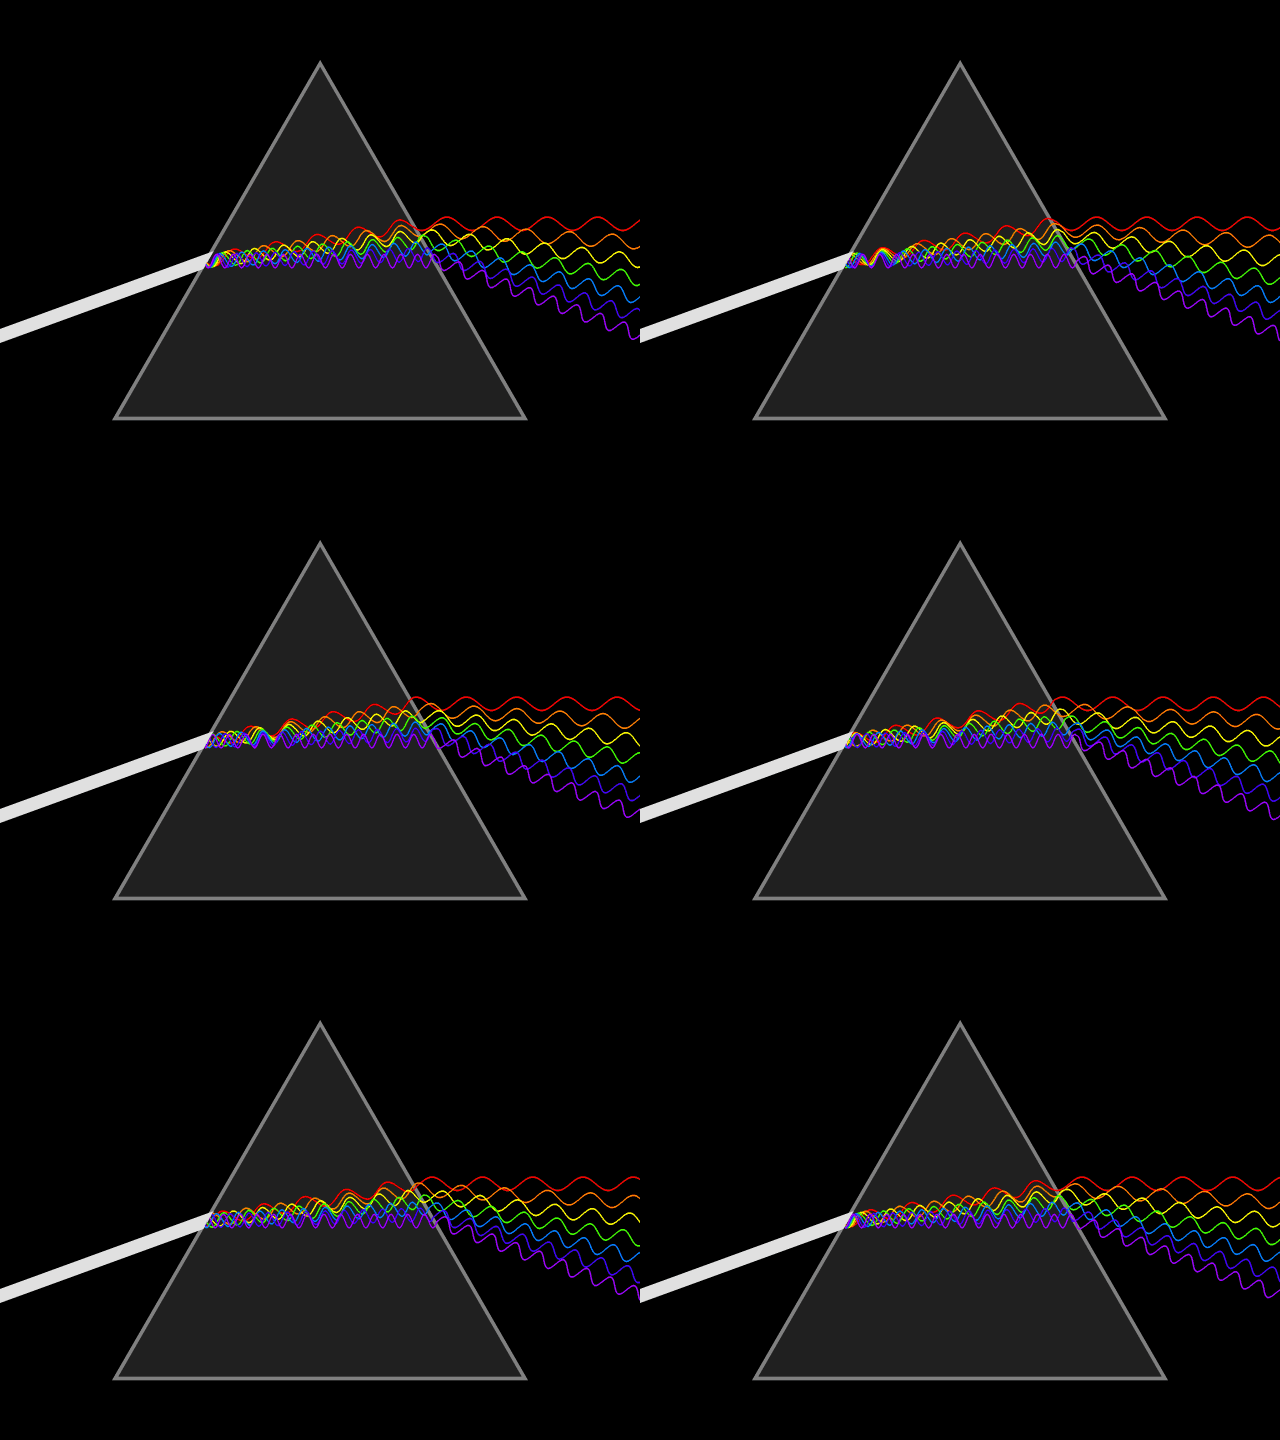
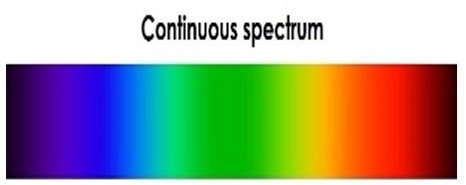
There are three kinds of spectra: continuous, absorption, and emission. Imagine a bright white light such as the one from the video you watched earlier. Continuous spectra can be formed as illustrated above and appear as illustrated below. Can you see how turning the image above clockwise by ninety degrees (so the spread out colors point down) produces the image below? Continuous spectra contain all visible colors (wavelengths), without any missing. Continuous spectra are created by hot, dense objects like the hot light bulb (filament) discussed above, hot coals, or stars.

To understand how absorption spectra work, imagine that we place a sheet between you and the continuous spectrum above. If the sheet were made of steel, what would you see? You would see nothing, because all the light would be blocked by the steel sheet, right? What if the sheet were made of a material that absorbed some of the light but let most of it pass through? What would you see in this case? You'd see a continuous spectrum with portions removed, as illustrated below. What removed those parts of the spectrum? They were absorbed by the matter in the sheet. Absorption spectra are continuous spectra from which parts have been removed—or severely depleted—as light passed through partially transparent (translucent) matter.

In our example, the plastic sheet was the intervening matter that absorbed light. In reality, plastic sheets usually just dim a broad portion of the spectrum by partially absorbing those wavelengths (colors); that is, plastic sheets don't usually entirely remove discreet spectral 'lines'. In nature, gas—in nebulae and the atmospheres of stars and planets—causes these 'black bands'. All stars, including our Sun, produce absorption spectra, because stars are surrounded by cooler gaseous atmospheres that act like the plastic sheet in our example. To understand how atoms and molecules in gas absorb light, we first need to understand how atoms emit light.
What would happen if we heated a single element, like sodium, to a relatively high temperature? If you’ve ever used a natural gas stove to boil spaghetti or soup, you've probably observed this phenomenon. What happens to the normally blue gas flame when a pot of spaghetti (...anyone hungry?!) boils over? The atoms in the spaghetti-water cause the blue gas flame to turn yellow, right? If you've never had this experience, don't worry: we're about to provide you with a better example.
The black box in the image below is a high voltage (5000 volts!) light, and the glowing 'light bulb' contains hydrogen gas (and no other atoms).
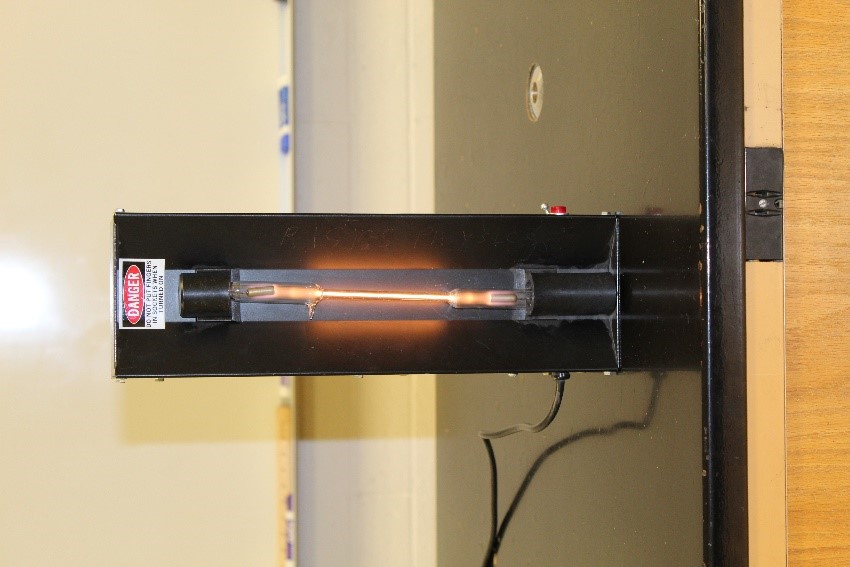
Imagine that we use a prism (or similar) to produce a spectrum of the Hydrogen light. What would you see? Instead of a continuous spectrum or an absorption spectrum, you would see a spectrum caused by light emitted by Hydrogen gas, as shown in the image below.

Emission spectra like this contain only discrete wavelengths of light—the colored vertical lines in the image above—separated by regions with no light—where wavelengths are missing. Each line in an emission spectrum has a particular wavelength, and each type of atom (element) has a distinctive 'fingerprint' of emitted colors, a unique set of emission lines. Emission spectra are produced by hot gas.
Having discovered that atoms in hot gas produces spectra with discrete emission lines, we're ready to discuss what produces the missing lines in absorptions spectra. In the mid 1800’s, Robert Bunsen (yes, the inventor of the 'Bunsen burner') and Gustav Kirchoff made the critical discovery. They observed that white light (a continuous spectrum) that passed through a 'cloud' of sodium-rich gas in their laboratory produced the familiar continuous spectrum minus spectral lines in the exact locations of sodium's visible emission lines. As we suspect is already clear to you, they concluded that—as the continuous light passed through the 'cloud'—the sodium atoms absorbed light at the wavelengths corresponding to the bright lines sodium produces when energized. Thus, Bunsen and Kirchoff discovered the key to understanding absorptions spectra.
In case it's not already clear, consider this analogy: Suppose you have a little brother who loves chocolate caramels but won't eat any other kind of chocolates. In addition, suppose that everyone else in your family is allergic to chocolate. Now, imagine that a friend (who is unaware that most of your family is allergic to chocolate) drops of a box containing candy chocolates of various types. Later in the day, you observe that the box is open and only the chocolate caramels are gone. What can you conclude from this observation? That your little brother found the box! In this same way, a cloud of cold gas (your little brother) selectively removes light (chocolates) from a continuous spectrum (the box containing various chocolates). Make sense?
In other words, whereas the bright lines in emission spectra result from energy emitted by hot gas atoms, the black lines in absorption spectra result from energy absorbed by cold gas atoms. That is, emission and absorption spectra are complements of each other. In this way, a cloud of hot hydrogen atoms will produce visible emission lines as shown in the emission spectrum above. And passing white light (a continuous spectrum) through a cloud of cold hydrogen atoms will produce an absorption spectrum with black absorption lines in the exact locations (same wavelengths) as the colored lines in the emission spectrum.
The pink-orange glow of the hydrogen tube above results from our eyes combining the hydrogen's three visible emission lines. Incidentally, the so-called 'neon lights' you are familiar with are emission tubes, and different elements (including neon) are used to produce different colors. If you used a prism (or similar) to observe the emission spectrum from a 'neon' light, you could identify the atom(s) inside the tube... because each element produces a unique emission pattern. The image below illustrates the uniqueness of emission spectra produced by different elements.
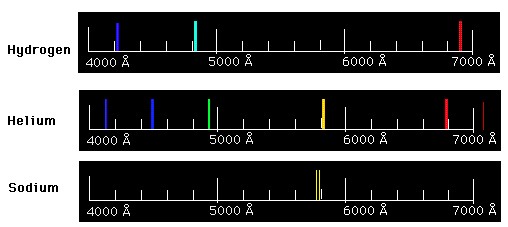
The uniqueness of elemental emission spectra allows astronomers to use emission spectra to determine the composition of distant objects.
Interpreting Composition from Observations of Spectra
Whether hot gas is inside a 'neon' sign in the room where you are located or that hot gas is in a nebula on the other side of the galaxy or Universe, the emission spectra produced by hot gas carries with it information about the atoms and molecules that comprise the gas. Isn't that incredible?! Even though atoms and molecules are too small to see with the naked eye, we can detect their presence from billions of light years away! Of course, light passing through cold gas likewise carries with it information about the atoms and molecules that comprise the gas—except in this case by removing spectral lines.
Use this file to explore the visible emission spectrum of different elements. For example, compare the spectra of smaller, simpler atoms such as hydrogen (H), Helium (He), & Oxygen (O) to the spectra of larger, more complex atoms such as magnesium (Mg), calcium (Ca), iron (Fe).
In the box below, describe how the spectra of larger elements such as magnesium, calcium, and iron differ from the spectra of smaller elements such as hydrogen, helium, and oxygen.
The spectrum at the bottom of the image below (the spectrum in the blue box) is a continuous spectrum that also contains emission lines (the bright vertical lines). Above that spectrum are spectra produced by individual elements. Use the upper spectra to determine which elements are in the astronomical object that produced the bottom spectrum.
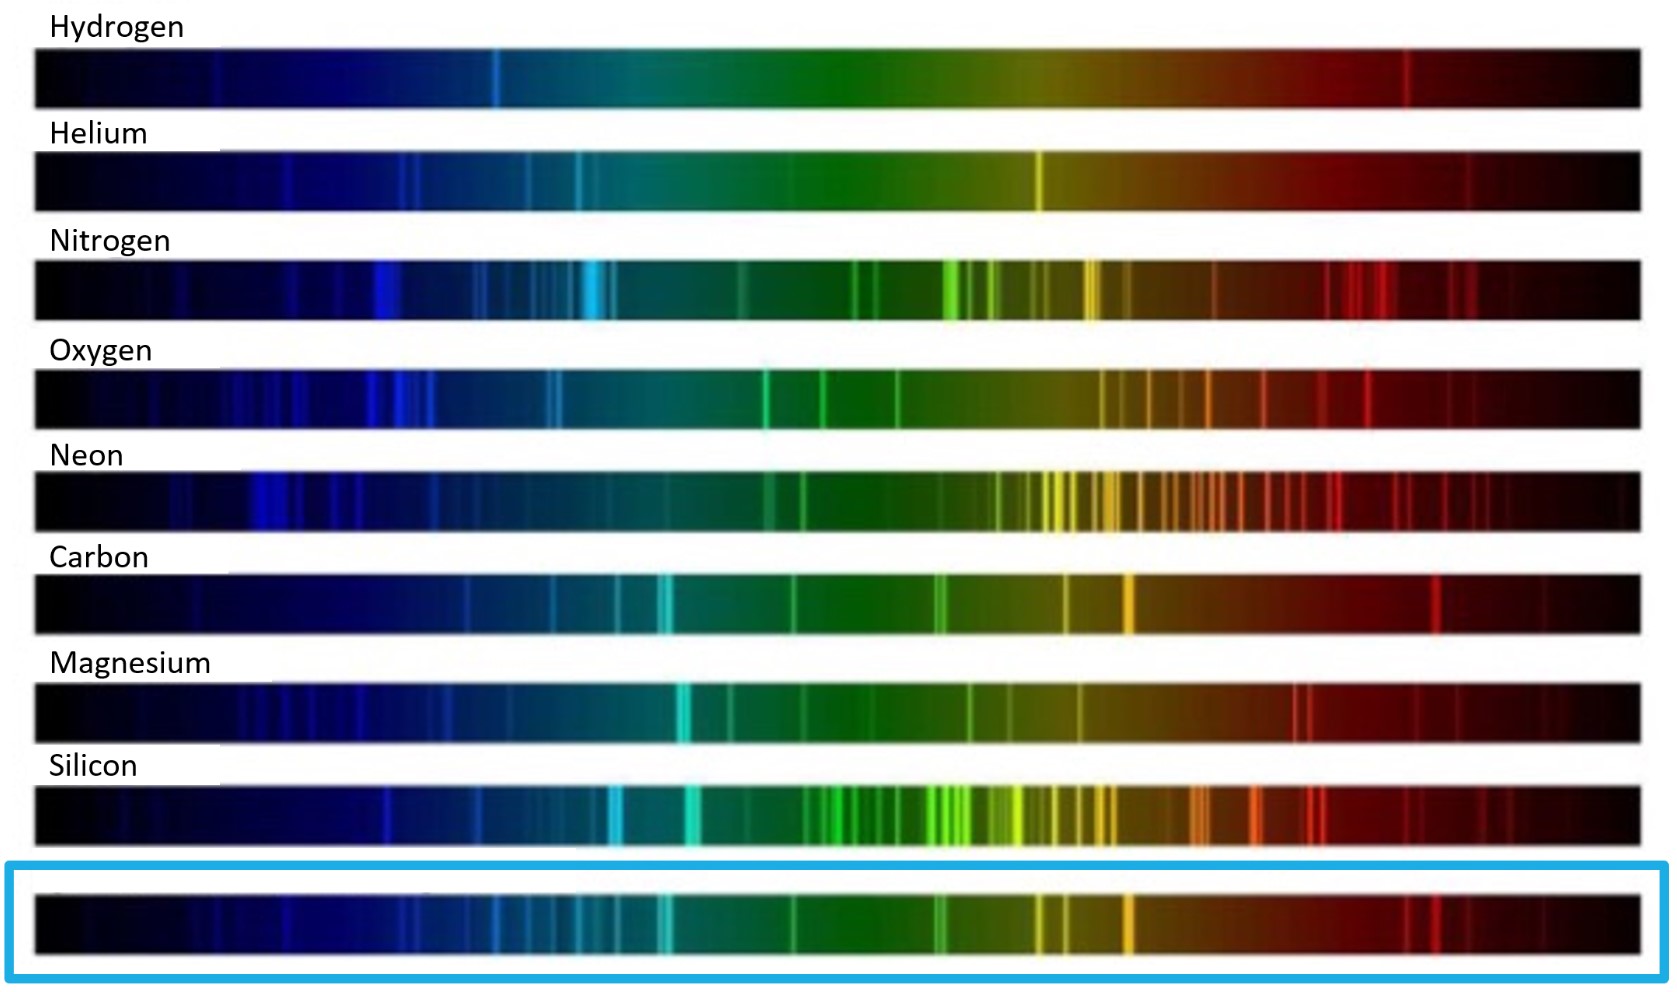
In the box below, make a list of the elements that are in the object that produced the bottom spectrum.
Let's do one more. The image below shows (at the top this time) the emission spectrum from a cloud of hot gas far from Earth. As above, use the elemental spectra provided (here located below the spectrum of the gaseous nebula).
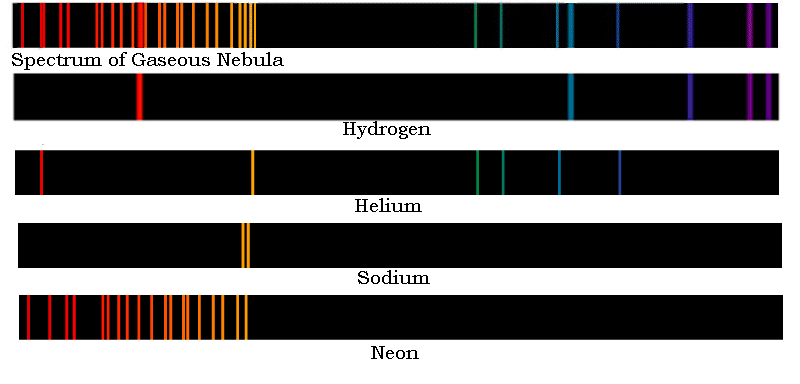
Make a list of the elements in the distant nebula in the box below.
Finally, let's look at the visible spectrum of our star, the Sun—which is shown below.

In the box below, identify 1) the type of spectrum produced by our star, the Sun and 2) whether the Sun contains just a few or many elements.
Number your answers (as above)
Interpreting the Motion of Stars and Galaxies from Observations of Spectra
Spectra are rich sources of information about the characteristics of objects in the Universe. In addition to providing humanity with information about the composition of distant objects, spectra carry information about the motion of astronomical objects such as stars, nebulae, and galaxies.
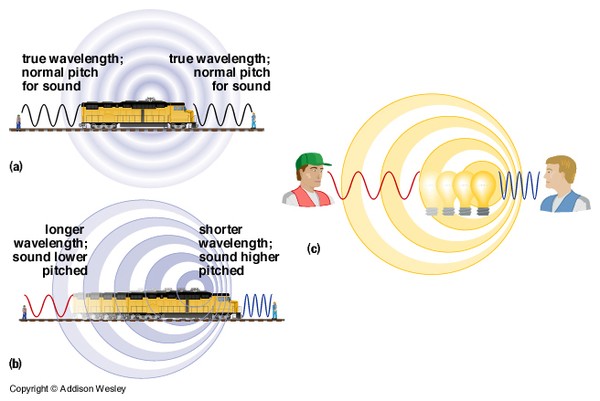
Most of you have heard of the Doppler effect. In fact, you hear it frequently. To remind yourself of this important effect, watch (and listen!) to this video of a train that blows its horn as it passes by. Pay particular attention to the change in sound as the train passes, and then answer the question below.
What happened to the pitch of the train horn as it passed by?
After completing the preceeding doppler simulation, answer the questions below by recording your observations in the appropriate boxes.
What happened to the wavelength (distance between successive part of the 'circles') in front of the moving plane (as compared to the stationary plane)?
What happened to the wavelength (distance between successive part of the 'circles') behind the moving plane (as compared to the stationary plane)?
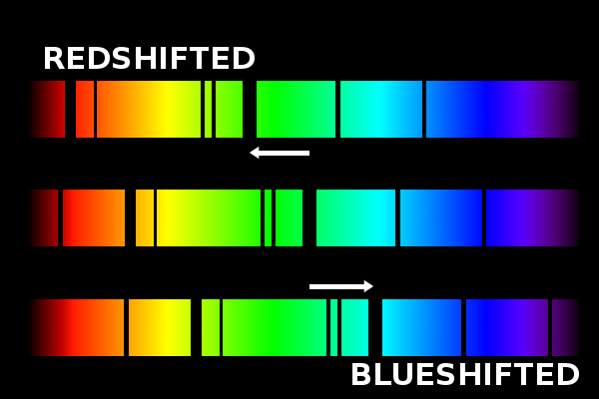
So, why are red- & blue-shifted light so important? Because observations of Doppler-shifted light provide humanity with the ability to interpret the motion of distant objects towards or away from Earth. To solidify your understanding, watch this video (3 min), which explains the Doppler effect and how we use it to determine the motion of distant objects.
Having better-developed our intuition about the Doppler effect, lets test our understanding. The upper spectrum in the image below is the now-familiar Hydrogen emission spectrum, at rest on Earth. The lower spectrum is also a hydrogen spectrum. Note that the emission lines are in the same relative positions. However, the lower spectrum was produced by hydrogen gas in a distant nebula that is moving with respect to Earth.

Based on what you know about the Doppler Effect, determine whether the nebula that produced the lower spectrum is moving towards or away from Earth. In other words, is the light from the nebula blue- or red-shifted? Record your answer below.
As above, all the spectra in the image below are Hydrogen emission spectra and the uppermost spectrum is at rest on Earth. Using '1' to refer to the reference spectrum (the top one), and then use 2, 3, 4, & 5 to refer to the other spectra (i.e., spectrum 5 would be the bottom spectrum). Identify the relative motion (compared to Earth, spectrum 1) of the objects that produced spectra 2 (2nd from top) through 5 (bottom). In other words, determine how quickly the objects are moving towards or away from Earth.
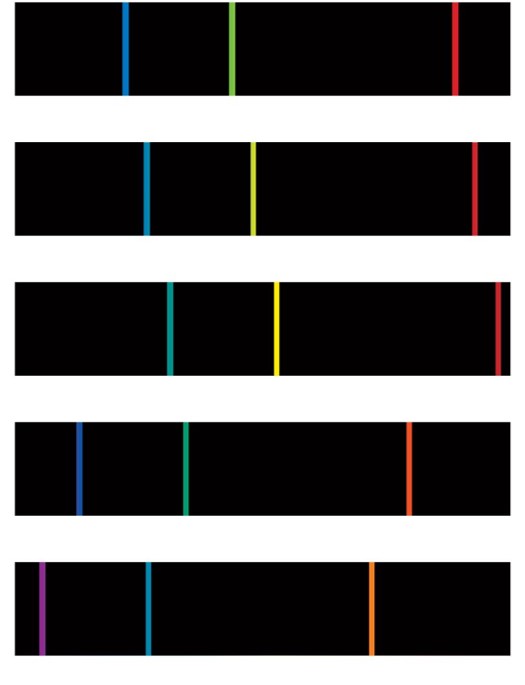
Record your answers in the box below using our numbering scheme..
Our final example relates to the side view of the Needle Galaxy shown in the image below. Imagine that we observe spectra from stars located inside the blue and yellow boxes, on opposite sides of the galaxy. To the left of the image lies a Hydrogen emission spectrum at rest on Earth and, below it, a H-emission spectrum produced by averaging the spectra of stars located inside the blue box. Likewise, to the right of the image, the lower spectrum is a H-emission spectrum produced by averaging the spectra of stars located inside the yellow box. Using these spectra, identify whether the objects in the blue and yellow boxes are moving towards or away from Earth.

Are the objects in the blue square moving toward us or away from us?
Are the objects in the yellow square moving toward us or away from us?
Study Aids
To assist students that struggle to understand how scientists observe and interpret the position, brightness, color, and spectrum of astronomical objects, we have provided the videos below. The videos represent full introductions to these topics and, as such, they are long. You are not required to view them.
This video (14.5 min) discusses how observations of color are interpreted.
This video (10 min) discusses how observations of position are interpreted.
This video (12 min) discusses how observations of brightness are interpreted.
This video (21 min) discusses how observations of spectra can be interpreted.
Distance and Age of Light
When humanity observes light from an astronomical object such as a star or galaxy, what does the distance to the object indicate about the age of the light? Watch these two videos to help you answer this question.
Watch this video (5.5 minutes) to better understand using light to measure stars.
Watch this video (2 minutes) to better understand how we look back in time when we look into the night sky.

